Netgear R7300DST User Manual - Page 188
Check the Internet Connection Status, ADVANCED, Show Statistics, System Up Time, Status, TxPkts
 |
View all Netgear R7300DST manuals
Add to My Manuals
Save this manual to your list of manuals |
Page 188 highlights
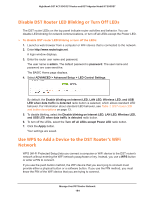
Nighthawk DST AC1900 DST Router and DST Adpater Model R7300DST 4. The BASIC Home page displays 5. Click the ADVANCED tab. 6. In the Internet Port pane, click the Show Statistics button. The following information displays: • System Up Time. The time elapsed since the DST router was last restarted. • Port. The statistics for the WAN (Internet) and LAN (Ethernet) ports. For each port, the page displays the following information: - Status. The link status of the port. - TxPkts. The number of packets transmitted on this port since reset or manual clear. - RxPkts. The number of packets received on this port since reset or manual clear. - Collisions. The number of collisions on this port since reset or manual clear. - Tx B/s. The current transmission (outbound) bandwidth used on the WAN and LAN ports. - Rx B/s. The current reception (inbound) bandwidth used on the WAN and LAN ports. - Up Time. The time elapsed since this port acquired the link. - Poll Interval. The interval at which the statistics are updated in this page. 7. To change the polling frequency, enter a time in seconds in the Poll Interval field and click the Set Interval button. 8. To stop the polling entirely, click the Stop button. Check the Internet Connection Status To check the Internet connection status: 1. Launch a web browser from a computer or WiFi device that is connected to the network. 2. Enter http://www.routerlogin.net. A login window displays. 3. Enter the router user name and password. Manage Your DST Router Network 188
-
 1
1 -
2
-
3
-
4
-
5
-
6
-
7
-
8
-
9
-
10
-
11
-
12
-
13
-
14
-
15
-
16
-
17
-
18
-
19
-
20
-
21
-
22
-
23
-
24
-
25
-
26
-
27
-
28
-
29
-
30
-
31
-
32
-
33
-
34
-
35
-
36
-
37
-
38
-
39
-
40
-
41
-
42
-
43
-
44
-
45
-
46
-
47
-
48
-
49
-
50
-
51
-
52
-
53
-
54
-
55
-
56
-
57
-
58
-
59
-
60
-
61
-
62
-
63
-
64
-
65
-
66
-
67
-
68
-
69
-
70
-
71
-
72
-
73
-
74
-
75
-
76
-
77
-
78
-
79
-
80
-
81
-
82
-
83
-
84
-
85
-
86
-
87
-
88
-
89
-
90
-
91
-
92
-
93
-
94
-
95
-
96
-
97
-
98
-
99
-
100
-
101
-
102
-
103
-
104
-
105
-
106
-
107
-
108
-
109
-
110
-
111
-
112
-
113
-
114
-
115
-
116
-
117
-
118
-
119
-
120
-
121
-
122
-
123
-
124
-
125
-
126
-
127
-
128
-
129
-
130
-
131
-
132
-
133
-
134
-
135
-
136
-
137
-
138
-
139
-
140
-
141
-
142
-
143
-
144
-
145
-
146
-
147
-
148
-
149
-
150
-
151
-
152
-
153
-
154
-
155
-
156
-
157
-
158
-
159
-
160
-
161
-
162
-
163
-
164
-
165
-
166
-
167
-
168
-
169
-
170
-
171
-
172
-
173
-
174
-
175
-
176
-
177
-
178
-
179
-
180
-
181
-
182
-
 183
183 -
 184
184 -
 185
185 -
 186
186 -
 187
187 -
 188
188 -
 189
189 -
 190
190 -
 191
191 -
 192
192 -
 193
193 -
194
-
195
-
196
-
197
-
198
-
199
-
200
-
201
-
202
-
203
-
204
-
205
-
206
-
207
-
208
-
209
-
210
-
211
-
212
-
213
-
214
-
215
-
216
-
217
-
218
-
219
-
220
-
221
-
222
-
223
-
224
-
225
-
226
-
227
-
228
-
229
-
230
-
231
-
232
-
233
-
234
-
235
-
236
-
237
-
238
-
239
-
240
-
241
-
242
-
243
-
244
-
245
-
246
-
247
-
248
-
249
-
250
-
251
-
252
-
253
-
254
-
255
-
256
-
257
-
258
-
259
-
260
-
261
-
262
-
263
-
264
-
265
-
266
 |
 |
