HP MSA 1040 HP MSA 1040 SMU Reference Guide (762784-001, March 2014) - Page 113

Disk performance, Serial Number.

Page 113 highlights

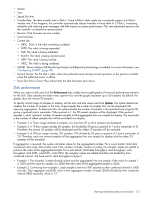
• Model. • Size. • Speed (kr/min). • Transfer Rate. The data transfer rate in Gbit/s. Some 6-Gbit/s disks might not consistently support a 6-Gbit/s transfer rate. If this happens, the controller automatically adjusts transfers to those disks to 3 Gbit/s, increasing reliability and reducing error messages with little impact on system performance. This rate adjustment persists until the controller is restarted or power-cycled. • Revision. Disk firmware revision number. • Serial Number. • Current Job. • DRSC: Disks in the vdisk are being scrubbed. • EXPD: The vdisk is being expanded. • INIT: The vdisk is being initialized. • RCON: The vdisk is being reconstructed. • VRFY: The vdisk is being verified. • VRSC: The vdisk is being scrubbed. • SMART. Shows whether Self-Monitoring Analysis and Reporting Technology is enabled. For more information, see "Configuring SMART" (page 49). • Current Owner. For the disk's vdisk, either the preferred owner during normal operation or the partner controller when the preferred owner is offline. • Drive Spin Down Count. How many times the disk has been spun down. Disk performance When you select a disk and click the Performance tab, a table shows eight graphs of historical performance statistics for the disk. Data samples are taken every quarter hour and the graphs represent up to 50 samples. By default, the graphs show the newest 50 samples. To specify a time range of samples to display, set the start and end values and click Update. The system determines whether the number of samples in the time range exceeds the number of samples that can be displayed (50), requiring aggregation. To determine this, the system divides the number of samples in the specified time range by 50, giving a quotient and a remainder. If the quotient is 1, the 50 newest samples will be displayed. If the quotient exceeds 1, each "quotient" number of newest samples will be aggregated into one sample for display. The remainder is the number of oldest samples that will be excluded from display. • Example 1: A 1-hour range includes 4 samples. 4 is less than 50 so all 4 samples are displayed. • Example 2: A 15-hour range includes 60 samples. 60 divided by 50 gives a quotient of 1 and a remainder of 10. Therefore, the newest 50 samples will be displayed and the oldest 10 samples will be excluded. • Example 3: A 30-hour range includes 120 samples. 120 divided by 50 gives a quotient of 2 and a remainder of 20. Therefore, each two newest samples will be aggregated into one sample for display and the oldest 20 samples will be excluded. If aggregation is required, the system calculates values for the aggregated samples. For a count statistic (total data transferred, data read, data written, total I/Os, number of reads, number of writes), the samples' values are added to produce the value of the aggregated sample. For a rate statistic (total data throughput, read throughput, write throughput, total IOPS, read IOPS, write IOPS), the samples' values are added and then are divided by their combined interval. The base unit for data throughput is bytes/s. • Example 1: Two samples' number-of-reads values must be aggregated into one sample. If the value for sample 1 is 1060 and the value for sample 2 is 2000 then the value of the aggregated sample is 3060. • Example 2: Continuing from example 1, each sample's interval is 900 seconds so their combined interval is 1800 seconds. Their aggregate read-IOPs value is their aggregate number of reads (3060) divided by their combined interval (1800 seconds), which is 1.7. Viewing information about an enclosure 113

  • 1
  • 2
  • 3
  • 4
  • 5
  • 6
  • 7
  • 8
  • 9
  • 10
  • 11
  • 12
  • 13
  • 14
  • 15
  • 16
  • 17
  • 18
  • 19
  • 20
  • 21
  • 22
  • 23
  • 24
  • 25
  • 26
  • 27
  • 28
  • 29
  • 30
  • 31
  • 32
  • 33
  • 34
  • 35
  • 36
  • 37
  • 38
  • 39
  • 40
  • 41
  • 42
  • 43
  • 44
  • 45
  • 46
  • 47
  • 48
  • 49
  • 50
  • 51
  • 52
  • 53
  • 54
  • 55
  • 56
  • 57
  • 58
  • 59
  • 60
  • 61
  • 62
  • 63
  • 64
  • 65
  • 66
  • 67
  • 68
  • 69
  • 70
  • 71
  • 72
  • 73
  • 74
  • 75
  • 76
  • 77
  • 78
  • 79
  • 80
  • 81
  • 82
  • 83
  • 84
  • 85
  • 86
  • 87
  • 88
  • 89
  • 90
  • 91
  • 92
  • 93
  • 94
  • 95
  • 96
  • 97
  • 98
  • 99
  • 100
  • 101
  • 102
  • 103
  • 104
  • 105
  • 106
  • 107
  • 108
  • 109
  • 110
  • 111
  • 112
  • 113
  • 114
  • 115
  • 116
  • 117
  • 118
  • 119
  • 120
  • 121
  • 122
  • 123
  • 124
  • 125
  • 126
  • 127
  • 128
  • 129
  • 130
  • 131
  • 132
  • 133
  • 134
  • 135
  • 136
  • 137
  • 138
  • 139
  • 140
  • 141
  • 142
  • 143
  • 144
  • 145
  • 146
  • 147
  • 148
  • 149
  • 150
  • 151
  • 152
  • 153
  • 154
  • 155
  • 156
  • 157
  • 158
  • 159
  • 160
  • 161
  • 162
  • 163
  • 164
  • 165
  • 166
  • 167
  • 168
  • 169
  • 170
  • 171
  • 172
  • 173
  • 174
  • 175
  • 176
  • 177
  • 178
  • 179
  • 180
  • 181
  • 182
  • 183
  • 184
  • 185
  • 186
  • 187
  • 188
  • 189
  • 190

Viewing information about an enclosure
113
Model.
Size.
Speed (kr/min).
Transfer Rate. The data transfer rate in Gbit/s. Some 6-Gbit/s disks might not consistently support a 6-Gbit/s
transfer rate. If this happens, the controller automatically adjusts transfers to those disks to 3 Gbit/s, increasing
reliability and reducing error messages with little impact on system performance. This rate adjustment persists until
the controller is restarted or power-cycled.
Revision. Disk firmware revision number.
Serial Number.
Current Job.
DRSC: Disks in the vdisk are being scrubbed.
EXPD: The vdisk is being expanded.
INIT: The vdisk is being initialized.
RCON: The vdisk is being reconstructed.
VRFY: The vdisk is being verified.
VRSC: The vdisk is being scrubbed.
SMART. Shows whether Self-Monitoring Analysis and Reporting Technology is enabled. For more information, see
"Configuring SMART" (page 49)
.
Current Owner. For the disk’s vdisk, either the preferred owner during normal operation or the partner controller
when the preferred owner is offline.
Drive Spin Down Count. How many times the disk has been spun down.
Disk performance
When you select a disk and click the
Performance
tab, a table shows eight graphs of historical performance statistics
for the disk. Data samples are taken every quarter hour and the graphs represent up to 50 samples. By default, the
graphs show the newest 50 samples.
To specify a time range of samples to display, set the start and end values and click
Update
. The system determines
whether the number of samples in the time range exceeds the number of samples that can be displayed (50),
requiring aggregation. To determine this, the system divides the number of samples in the specified time range by 50,
giving a quotient and a remainder. If the quotient is 1, the 50 newest samples will be displayed. If the quotient
exceeds 1, each “quotient” number of newest samples will be aggregated into one sample for display. The remainder
is the number of oldest samples that will be excluded from display.
Example 1: A 1-hour range includes 4 samples. 4 is less than 50 so all 4 samples are displayed.
Example 2: A 15-hour range includes 60 samples. 60 divided by 50 gives a quotient of 1 and a remainder of 10.
Therefore, the newest 50 samples will be displayed and the oldest 10 samples will be excluded.
Example 3: A 30-hour range includes 120 samples. 120 divided by 50 gives a quotient of 2 and a remainder of
20. Therefore, each two newest samples will be aggregated into one sample for display and the oldest 20
samples will be excluded.
If aggregation is required, the system calculates values for the aggregated samples. For a count statistic (total data
transferred, data read, data written, total I/Os, number of reads, number of writes), the samples’ values are added to
produce the value of the aggregated sample. For a rate statistic (total data throughput, read throughput, write
throughput, total IOPS, read IOPS, write IOPS), the samples’ values are added and then are divided by their
combined interval. The base unit for data throughput is bytes/s.
Example 1: Two samples’ number-of-reads values must be aggregated into one sample. If the value for sample 1
is 1060 and the value for sample 2 is 2000 then the value of the aggregated sample is 3060.
Example 2: Continuing from example 1, each sample’s interval is 900 seconds so their combined interval is 1800
seconds. Their aggregate read-IOPs value is their aggregate number of reads (3060) divided by their combined
interval (1800 seconds), which is 1.7.