HP MSA 1040 HP MSA 1040 SMU Reference Guide (762784-001, March 2014) - Page 114
Power supply properties
 |
View all HP MSA 1040 manuals
Add to My Manuals
Save this manual to your list of manuals |
Page 114 highlights
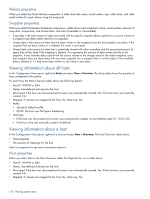
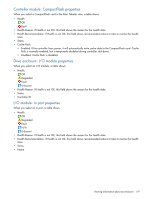
The system will change the time settings to match the times of the oldest and newest samples displayed. The graphs are updated each time you click either the Performance tab or the Update button. • Data Transferred. Shows the amounts of data read and written and the combined total over the sampling time period. The base unit is bytes. • Data Throughput. Shows the rates at which data are read and written and the combined total over the sampling time period. The base unit is bytes/s. • I/O. Shows the numbers of reads and writes and the combined total over the sampling time period. • IOPS. Shows numbers of reads and writes per second and the combined total over the sampling time period. • Average Response Time. Shows the average response times for reads and writes and the combined average over the sampling time period. The base unit is microseconds. • Average I/O Size. Shows the average sizes of reads and writes and the combined average over the sampling time period. The base unit is bytes. • Disk Error Counters. Shows the number of disk errors over the sampling time period. • Average Queue Depth. Shows the average number of pending I/O operations that are being serviced over the sampling time period. This value represents periods of activity only and excludes periods of inactivity. TIP: If you specify a time range, it is recommended to specify a range of 12 hours or less. To view summary performance data for a vdisk, use the Vdisk Overview panel as described on page 100. To view live (non-historical) performance statistics for one or more disks, in the CLI use the show disk-statistics command. Power supply properties When you select a power supply, a table shows: • Health. OK Degraded Fault Unknown • Health Reason. If Health is not OK, this field shows the reason for the health state. • Health Recommendation. If Health is not OK, this field shows recommended actions to take to resolve the health issue. • Status. • Model. • Vendor. • Location. • Serial Number. • Revision. • Part Number. • Manufacturing Date. • Manufacturing Location. 114 Viewing system status
-
 1
1 -
2
-
3
-
4
-
5
-
6
-
7
-
8
-
9
-
10
-
11
-
12
-
13
-
14
-
15
-
16
-
17
-
18
-
19
-
20
-
21
-
22
-
23
-
24
-
25
-
26
-
27
-
28
-
29
-
30
-
31
-
32
-
33
-
34
-
35
-
36
-
37
-
38
-
39
-
40
-
41
-
42
-
43
-
44
-
45
-
46
-
47
-
48
-
49
-
50
-
51
-
52
-
53
-
54
-
55
-
56
-
57
-
58
-
59
-
60
-
61
-
62
-
63
-
64
-
65
-
66
-
67
-
68
-
69
-
70
-
71
-
72
-
73
-
74
-
75
-
76
-
77
-
78
-
79
-
80
-
81
-
82
-
83
-
84
-
85
-
86
-
87
-
88
-
89
-
90
-
91
-
92
-
93
-
94
-
95
-
96
-
97
-
98
-
99
-
100
-
101
-
102
-
103
-
104
-
105
-
106
-
107
-
108
-
 109
109 -
 110
110 -
 111
111 -
 112
112 -
 113
113 -
 114
114 -
 115
115 -
 116
116 -
 117
117 -
 118
118 -
 119
119 -
120
-
121
-
122
-
123
-
124
-
125
-
126
-
127
-
128
-
129
-
130
-
131
-
132
-
133
-
134
-
135
-
136
-
137
-
138
-
139
-
140
-
141
-
142
-
143
-
144
-
145
-
146
-
147
-
148
-
149
-
150
-
151
-
152
-
153
-
154
-
155
-
156
-
157
-
158
-
159
-
160
-
161
-
162
-
163
-
164
-
165
-
166
-
167
-
168
-
169
-
170
-
171
-
172
-
173
-
174
-
175
-
176
-
177
-
178
-
179
-
180
-
181
-
182
-
183
-
184
-
185
-
186
-
187
-
188
-
189
-
190
 |
 |