HP MSA 1040 HP MSA 1040 SMU Reference Guide (762784-001, March 2014) - Page 98

Viewing the system event log, To access HP's Guided Troubleshooting website, see - review

Page 98 highlights

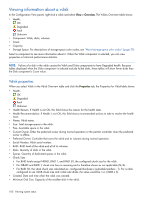
Viewing the system event log In the Configuration View panel, right-click the system and select View > Event Log. The System Events panel shows the 100 most recent events that have been logged by either controller. All events are logged, regardless of event-notification settings. Click the buttons above the table to view all events, or only critical, warning, or informational events. The event log table shows the following information: • Severity. Critical. A failure occurred that may cause a controller to shut down. Correct the problem immediately. Error. A failure occurred that may affect data integrity or system stability. Correct the problem as soon as possible. Warning. A problem occurred that may affect system stability but not data integrity. Evaluate the problem and correct it if necessary. Informational. A configuration or state change occurred, or a problem occurred that the system corrected. No action is required. • Time. Date and time when the event occurred, shown as year-month-day hour:minutes:seconds. Time stamps have one-second granularity. • Event ID. An identifier for the event. The prefix A or B identifies the controller that logged the event. • Code. An event code that helps you and support personnel diagnose problems. For event-code descriptions and recommended actions, see the Event Descriptions Reference Guide. • Message. Brief information about the event. Click the message to show or hide additional information and recommended actions. NOTE: If you are having a problem with the system or a vdisk, check the event log before calling technical support. Event messages might enable you to resolve the problem. When reviewing events, do the following: 1. For any critical, error, or warning events, click the message to view additional information and recommended actions. This information also appears in the Event Descriptions Reference Guide. Identify the primary events and any that might be the cause of the primary event. For example, an over-temperature event could cause a disk failure. 2. View the event log and locate other critical/error/warning events in the sequence for the controller that reported the event. Repeat this step for the other controller if necessary. 3. Review the events that occurred before and after the primary event. During this review you are looking for any events that might indicate the cause of the critical/error/warning event. You are also looking for events that resulted from the critical/error/warning event, known as secondary events. 4. Review the events following the primary and secondary events. You are looking for any actions that might have already been taken to resolve the problems reported by the events. To access HP's Guided Troubleshooting website, see http://www.hp.com/support/msa1040. 98 Viewing system status

  • 1
  • 2
  • 3
  • 4
  • 5
  • 6
  • 7
  • 8
  • 9
  • 10
  • 11
  • 12
  • 13
  • 14
  • 15
  • 16
  • 17
  • 18
  • 19
  • 20
  • 21
  • 22
  • 23
  • 24
  • 25
  • 26
  • 27
  • 28
  • 29
  • 30
  • 31
  • 32
  • 33
  • 34
  • 35
  • 36
  • 37
  • 38
  • 39
  • 40
  • 41
  • 42
  • 43
  • 44
  • 45
  • 46
  • 47
  • 48
  • 49
  • 50
  • 51
  • 52
  • 53
  • 54
  • 55
  • 56
  • 57
  • 58
  • 59
  • 60
  • 61
  • 62
  • 63
  • 64
  • 65
  • 66
  • 67
  • 68
  • 69
  • 70
  • 71
  • 72
  • 73
  • 74
  • 75
  • 76
  • 77
  • 78
  • 79
  • 80
  • 81
  • 82
  • 83
  • 84
  • 85
  • 86
  • 87
  • 88
  • 89
  • 90
  • 91
  • 92
  • 93
  • 94
  • 95
  • 96
  • 97
  • 98
  • 99
  • 100
  • 101
  • 102
  • 103
  • 104
  • 105
  • 106
  • 107
  • 108
  • 109
  • 110
  • 111
  • 112
  • 113
  • 114
  • 115
  • 116
  • 117
  • 118
  • 119
  • 120
  • 121
  • 122
  • 123
  • 124
  • 125
  • 126
  • 127
  • 128
  • 129
  • 130
  • 131
  • 132
  • 133
  • 134
  • 135
  • 136
  • 137
  • 138
  • 139
  • 140
  • 141
  • 142
  • 143
  • 144
  • 145
  • 146
  • 147
  • 148
  • 149
  • 150
  • 151
  • 152
  • 153
  • 154
  • 155
  • 156
  • 157
  • 158
  • 159
  • 160
  • 161
  • 162
  • 163
  • 164
  • 165
  • 166
  • 167
  • 168
  • 169
  • 170
  • 171
  • 172
  • 173
  • 174
  • 175
  • 176
  • 177
  • 178
  • 179
  • 180
  • 181
  • 182
  • 183
  • 184
  • 185
  • 186
  • 187
  • 188
  • 189
  • 190

98
Viewing system status
Viewing the system event log
In the Configuration View panel, right-click the system and select
View > Event Log
. The System Events panel shows
the 100 most recent events that have been logged by either controller. All events are logged, regardless of
event-notification settings. Click the buttons above the table to view all events, or only critical, warning, or
informational events.
The event log table shows the following information:
Severity.
Critical. A failure occurred that may cause a controller to shut down. Correct the problem
immediately
.
Error. A failure occurred that may affect data integrity or system stability. Correct the problem as soon as
possible.
Warning. A problem occurred that may affect system stability but not data integrity. Evaluate the problem and
correct it if necessary.
Informational. A configuration or state change occurred, or a problem occurred that the system corrected. No
action is required.
Time. Date and time when the event occurred, shown as
year
-
month
-
day
hour
:
minutes
:
seconds
. Time stamps have
one-second granularity.
Event ID. An identifier for the event. The prefix A or B identifies the controller that logged the event.
Code. An event code that helps you and support personnel diagnose problems. For event-code descriptions and
recommended actions, see the Event Descriptions Reference Guide.
Message. Brief information about the event. Click the message to show or hide additional information and
recommended actions.
NOTE:
If you are having a problem with the system or a vdisk, check the event log before calling technical support.
Event messages might enable you to resolve the problem.
When reviewing events, do the following:
1.
For any critical, error, or warning events, click the message to view additional information and recommended
actions. This information also appears in the Event Descriptions Reference Guide.
Identify the primary events and any that might be the cause of the primary event. For example, an
over-temperature event could cause a disk failure.
2.
View the event log and locate other critical/error/warning events in the sequence for the controller that reported
the event.
Repeat this step for the other controller if necessary.
3.
Review the events that occurred before and after the primary event.
During this review you are looking for any events that might indicate the cause of the critical/error/warning event.
You are also looking for events that resulted from the critical/error/warning event, known as secondary events.
4.
Review the events following the primary and secondary events.
You are looking for any actions that might have already been taken to resolve the problems reported by the
events.
To access HP’s Guided Troubleshooting website, see
.