Dell Powerconnect W-ClearPass Hardware Appliances W-ClearPass Policy Manager 6 - Page 19
Policy Manager Dashboard, The Policy Manager
 |
View all Dell Powerconnect W-ClearPass Hardware Appliances manuals
Add to My Manuals
Save this manual to your list of manuals |
Page 19 highlights
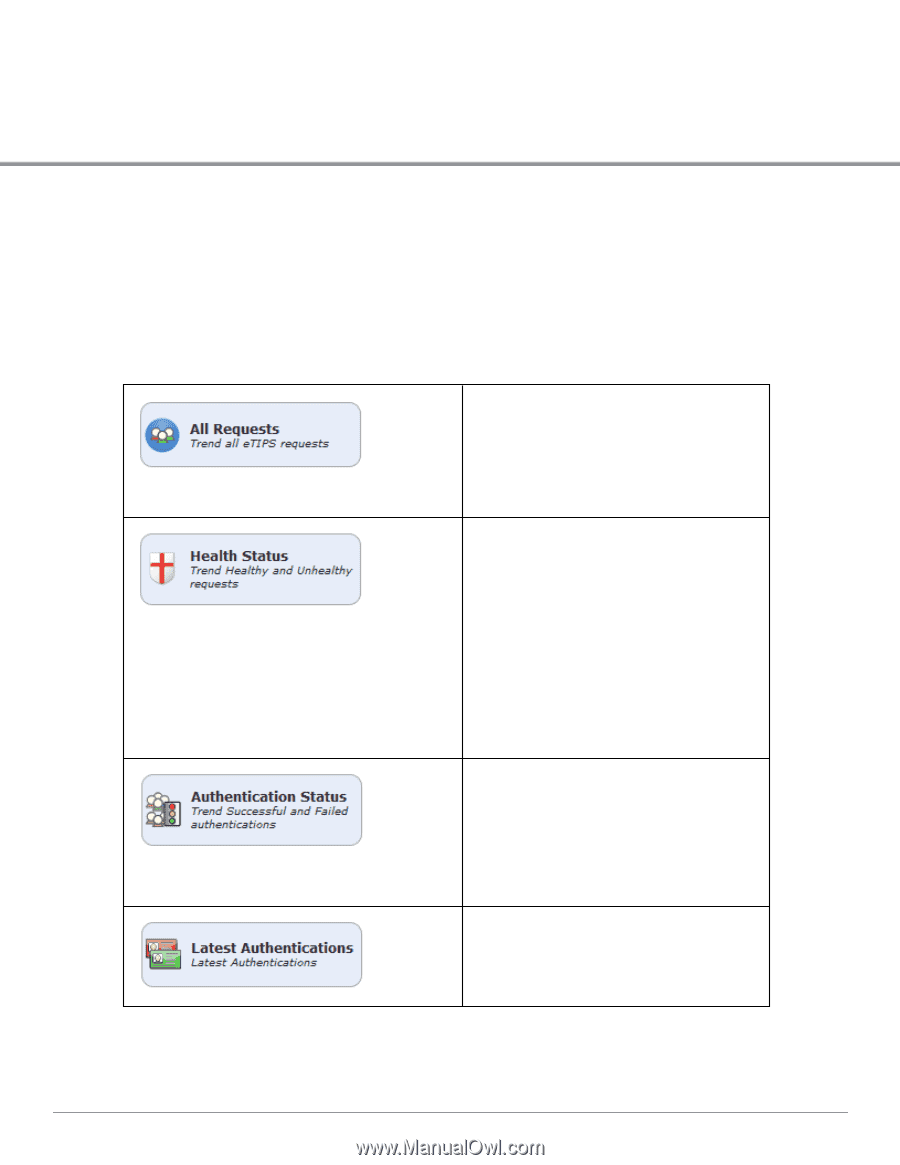
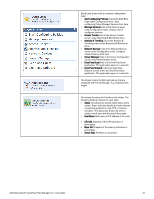
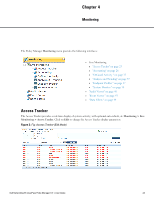
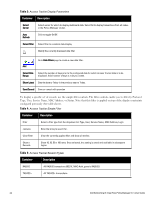
Chapter 3 Policy Manager Dashboard The Policy Manager Dashboard menu allows you to display system health and other request related statistics. Policy Manager comes pre-configured with different dashboard elements. The screen on the right of the dashboard menu is partitioned into five fixed slots. You can drag and drop any of the dashboard elements into the five slots. The dashboard elements are listed below: This shows a graph of all requests processed by Policy Manager over the past week. This includes RADIUS, TACACS+ and WebAuth requests. The default data filter "All Requests" is used to plot this graph. Clicking on each bar in the graph drills down into the Access Tracker and shows the requests for that day. This shows a graph of the "Healthy" vs. "Unhealthy" requests over the past week. Healthy requests are those requests where the health state was deemed to be healthy (based on the posture data sent from the client). Unhealthy requests are those requests whose health state was deemed to be quarantined (posture data received but health status is not compliant) or unknown (no posture data received). This includes RADIUS and WebAuth requests. The default data filters "Health Requests" and "Unhealthy Requests" are used to plot this graph. Clicking on each circle on the line graph drills down into the Access Tracker and shows the healthy or unhealthy requests for that day. This shows a graph of the "Failed" vs. "Successful" requests over the past week. This includes RADIUS, WebAuth and TACACS+ requests. The default data filters "Failed Requests" and "Successful Requests" are used to plot this graph. Clicking on each circle on the line graph drills down into the Access Tracker and shows the failed or successful requests for that day. This shows a table of the last few authentications. Clicking on a row drills down into the Access Tracker and shows requests sorted by timestamp with the latest request showing first. Dell Networking W-ClearPass Policy Manager 6.0 | User Guide 19
-
 1
1 -
2
-
3
-
4
-
5
-
6
-
7
-
8
-
9
-
10
-
11
-
12
-
13
-
 14
14 -
 15
15 -
 16
16 -
 17
17 -
 18
18 -
 19
19 -
 20
20 -
 21
21 -
 22
22 -
 23
23 -
 24
24 -
25
-
26
-
27
-
28
-
29
-
30
-
31
-
32
-
33
-
34
-
35
-
36
-
37
-
38
-
39
-
40
-
41
-
42
-
43
-
44
-
45
-
46
-
47
-
48
-
49
-
50
-
51
-
52
-
53
-
54
-
55
-
56
-
57
-
58
-
59
-
60
-
61
-
62
-
63
-
64
-
65
-
66
-
67
-
68
-
69
-
70
-
71
-
72
-
73
-
74
-
75
-
76
-
77
-
78
-
79
-
80
-
81
-
82
-
83
-
84
-
85
-
86
-
87
-
88
-
89
-
90
-
91
-
92
-
93
-
94
-
95
-
96
-
97
-
98
-
99
-
100
-
101
-
102
-
103
-
104
-
105
-
106
-
107
-
108
-
109
-
110
-
111
-
112
-
113
-
114
-
115
-
116
-
117
-
118
-
119
-
120
-
121
-
122
-
123
-
124
-
125
-
126
-
127
-
128
-
129
-
130
-
131
-
132
-
133
-
134
-
135
-
136
-
137
-
138
-
139
-
140
-
141
-
142
-
143
-
144
-
145
-
146
-
147
-
148
-
149
-
150
-
151
-
152
-
153
-
154
-
155
-
156
-
157
-
158
-
159
-
160
-
161
-
162
-
163
-
164
-
165
-
166
-
167
-
168
-
169
-
170
-
171
-
172
-
173
-
174
-
175
-
176
-
177
-
178
-
179
-
180
-
181
-
182
-
183
-
184
-
185
-
186
-
187
-
188
-
189
-
190
-
191
-
192
-
193
-
194
-
195
-
196
-
197
-
198
-
199
-
200
-
201
-
202
-
203
-
204
-
205
-
206
-
207
-
208
-
209
-
210
-
211
-
212
-
213
-
214
-
215
-
216
-
217
-
218
-
219
-
220
-
221
-
222
-
223
-
224
-
225
-
226
-
227
-
228
-
229
-
230
-
231
-
232
-
233
-
234
-
235
-
236
-
237
-
238
-
239
-
240
-
241
-
242
-
243
-
244
-
245
-
246
-
247
-
248
-
249
-
250
-
251
-
252
-
253
-
254
-
255
-
256
-
257
-
258
-
259
-
260
-
261
-
262
-
263
-
264
-
265
-
266
-
267
-
268
-
269
-
270
-
271
-
272
-
273
-
274
-
275
-
276
-
277
-
278
-
279
-
280
-
281
-
282
-
283
-
284
-
285
-
286
-
287
-
288
-
289
-
290
-
291
-
292
-
293
-
294
-
295
-
296
-
297
-
298
-
299
-
300
-
301
-
302
-
303
-
304
-
305
-
306
-
307
-
308
-
309
-
310
-
311
-
312
-
313
-
314
-
315
-
316
-
317
-
318
-
319
-
320
-
321
-
322
-
323
-
324
-
325
-
326
-
327
-
328
-
329
-
330
-
331
-
332
-
333
-
334
-
335
-
336
-
337
-
338
-
339
-
340
-
341
-
342
-
343
-
344
-
345
-
346
-
347
-
348
-
349
-
350
-
351
-
352
-
353
-
354
-
355
-
356
-
357
-
358
-
359
-
360
-
361
-
362
-
363
-
364
-
365
-
366
-
367
-
368
-
369
-
370
-
371
-
372
 |
 |