Dell Powerconnect W-ClearPass Hardware Appliances W-ClearPass Policy Manager 6 - Page 37
Analysis and Trending, Endpoint Profiler, Monitoring > Live Monitoring > Analysis & Trending
 |
View all Dell Powerconnect W-ClearPass Hardware Appliances manuals
Add to My Manuals
Save this manual to your list of manuals |
Page 37 highlights
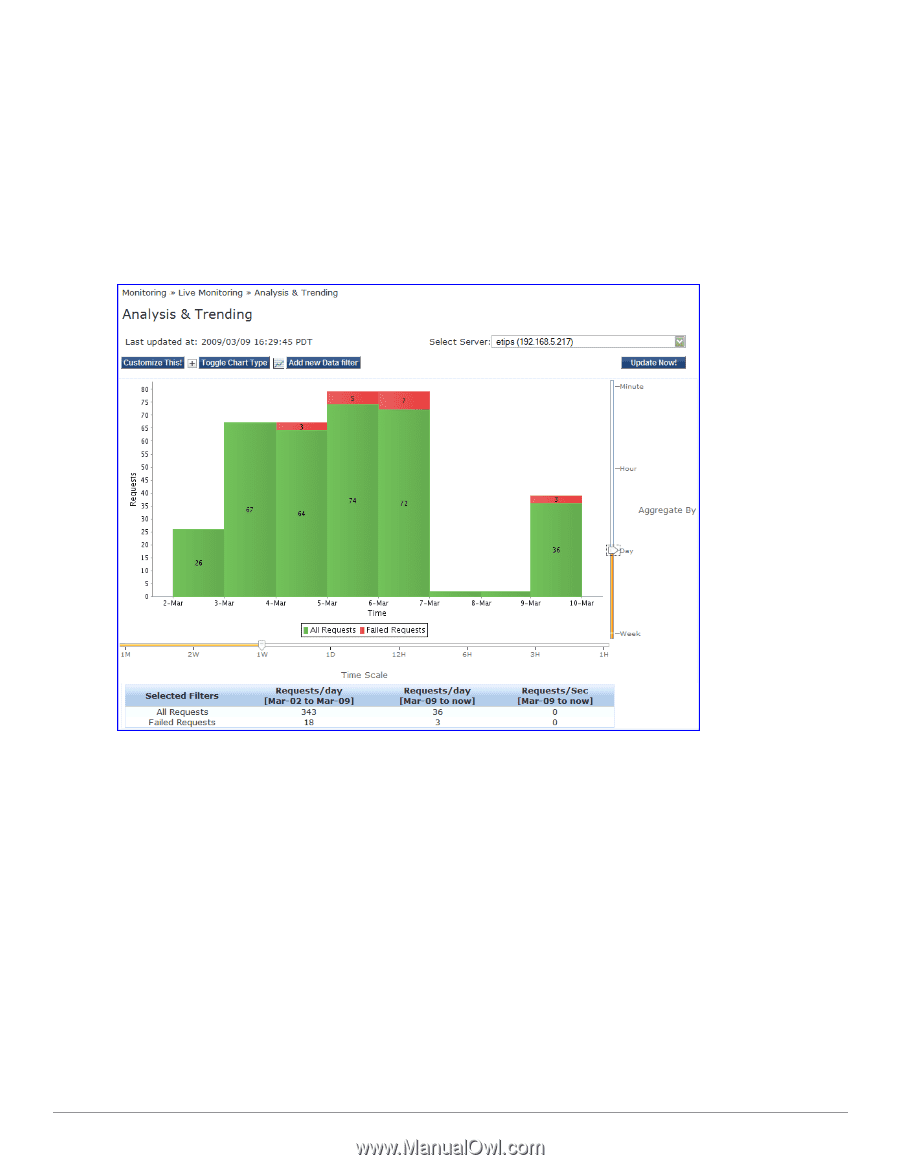
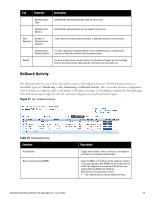
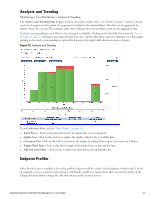
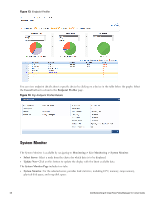
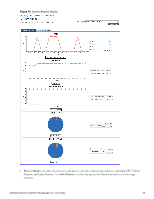
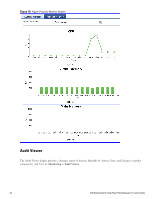
Analysis and Trending Monitoring > Live Monitoring > Analysis & Trending The Analysis and Trending Page displays monthly, bi-weekly, weekly, daily, or 12-hourly, 6-hourly, 3-hourly or hourly quantity of requests for the subset of components included in the selected filters. The data can be aggregated by minute, hour, day or week. The summary table at the bottom shows the per-filter count for the aggregated data. Each bar (corresponding to each filter) in the bar graph is clickable. Clicking on the bar drills down into the "Access Tracker" on page 23, showing session data for that time slice (and for that many requests). Similarly, for a line graph, clicking on the circle (corresponding to each plotted point in the graph) drills down into Access Tracker. Figure 12: Analysis and Trending To add additional filters, refer to "Data Filters " on page 44. l Select Server - Select a node from the cluster for which data is to be displayed. l Update Now- Click on this button to update the display with the latest available data. l Customize This- Click on this link to customize the display by adding filters (up to a maximum of 4 filters) l Toggle Chart Type- Click on this link to toggle chart display between line and bar type. l Add New Data Filter - Click on this to add a new data filter in the global filter list. Endpoint Profiler If the Profile license is enabled, a list of the profiled endpoints will be visible in the Endpoints Profiler table. The list of endpoints you see is based on the Category, OS Family, and Device Name items that you selected. Click on the Change Selection link to change the selection criteria used to list the devices. Dell Networking W-ClearPass Policy Manager 6.0 | User Guide 37
-
 1
1 -
2
-
3
-
4
-
5
-
6
-
7
-
8
-
9
-
10
-
11
-
12
-
13
-
14
-
15
-
16
-
17
-
18
-
19
-
20
-
21
-
22
-
23
-
24
-
25
-
26
-
27
-
28
-
29
-
30
-
31
-
 32
32 -
 33
33 -
 34
34 -
 35
35 -
 36
36 -
 37
37 -
 38
38 -
 39
39 -
 40
40 -
 41
41 -
 42
42 -
43
-
44
-
45
-
46
-
47
-
48
-
49
-
50
-
51
-
52
-
53
-
54
-
55
-
56
-
57
-
58
-
59
-
60
-
61
-
62
-
63
-
64
-
65
-
66
-
67
-
68
-
69
-
70
-
71
-
72
-
73
-
74
-
75
-
76
-
77
-
78
-
79
-
80
-
81
-
82
-
83
-
84
-
85
-
86
-
87
-
88
-
89
-
90
-
91
-
92
-
93
-
94
-
95
-
96
-
97
-
98
-
99
-
100
-
101
-
102
-
103
-
104
-
105
-
106
-
107
-
108
-
109
-
110
-
111
-
112
-
113
-
114
-
115
-
116
-
117
-
118
-
119
-
120
-
121
-
122
-
123
-
124
-
125
-
126
-
127
-
128
-
129
-
130
-
131
-
132
-
133
-
134
-
135
-
136
-
137
-
138
-
139
-
140
-
141
-
142
-
143
-
144
-
145
-
146
-
147
-
148
-
149
-
150
-
151
-
152
-
153
-
154
-
155
-
156
-
157
-
158
-
159
-
160
-
161
-
162
-
163
-
164
-
165
-
166
-
167
-
168
-
169
-
170
-
171
-
172
-
173
-
174
-
175
-
176
-
177
-
178
-
179
-
180
-
181
-
182
-
183
-
184
-
185
-
186
-
187
-
188
-
189
-
190
-
191
-
192
-
193
-
194
-
195
-
196
-
197
-
198
-
199
-
200
-
201
-
202
-
203
-
204
-
205
-
206
-
207
-
208
-
209
-
210
-
211
-
212
-
213
-
214
-
215
-
216
-
217
-
218
-
219
-
220
-
221
-
222
-
223
-
224
-
225
-
226
-
227
-
228
-
229
-
230
-
231
-
232
-
233
-
234
-
235
-
236
-
237
-
238
-
239
-
240
-
241
-
242
-
243
-
244
-
245
-
246
-
247
-
248
-
249
-
250
-
251
-
252
-
253
-
254
-
255
-
256
-
257
-
258
-
259
-
260
-
261
-
262
-
263
-
264
-
265
-
266
-
267
-
268
-
269
-
270
-
271
-
272
-
273
-
274
-
275
-
276
-
277
-
278
-
279
-
280
-
281
-
282
-
283
-
284
-
285
-
286
-
287
-
288
-
289
-
290
-
291
-
292
-
293
-
294
-
295
-
296
-
297
-
298
-
299
-
300
-
301
-
302
-
303
-
304
-
305
-
306
-
307
-
308
-
309
-
310
-
311
-
312
-
313
-
314
-
315
-
316
-
317
-
318
-
319
-
320
-
321
-
322
-
323
-
324
-
325
-
326
-
327
-
328
-
329
-
330
-
331
-
332
-
333
-
334
-
335
-
336
-
337
-
338
-
339
-
340
-
341
-
342
-
343
-
344
-
345
-
346
-
347
-
348
-
349
-
350
-
351
-
352
-
353
-
354
-
355
-
356
-
357
-
358
-
359
-
360
-
361
-
362
-
363
-
364
-
365
-
366
-
367
-
368
-
369
-
370
-
371
-
372
 |
 |