Netgear GS716Tv2 GS716Tv2/GS724Tv3 Software Admin Manual - Page 187
Port Detailed Statistics, Clear, Refresh, Monitoring, Ports
 |
View all Netgear GS716Tv2 manuals
Add to My Manuals
Save this manual to your list of manuals |
Page 187 highlights
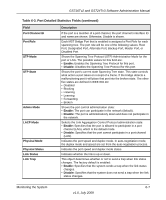
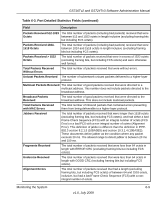
GS716Tv2 and GS724Tv3 Software Administration Manual Table 6-2. Port Statistics Fields Field Description Interface Lists the ports on the system. Total Packets Received Without Errors The total number of packets received that were without errors. Packets Received With Error The number of inbound packets that contained errors preventing them from being deliverable to a higher-layer protocol. Broadcast Packets Received The total number of good packets received that were directed to the broadcast address. This does not include multicast packets. Packets Transmitted Without Errors The number of frames that have been transmitted by this port to its segment. Transmit Packet Errors The number of outbound packets that could not be transmitted because of errors. Collision Frames The best estimate of the total number of collisions on this Ethernet segment. Time Since Counters Last The elapsed time, in days, hours, minutes, and seconds since the Cleared statistics for this port were last cleared. 2. To clear all the counters for all ports on the switch, select the check box in the row heading and click Clear. The button resets all statistics for all ports to default values. 3. To clear the counters for a specific port, select the check box associated with the port and click Clear. 4. Click Refresh to refresh the data on the screen and display the most current statistics. Port Detailed Statistics The Port Detailed Statistics page displays a variety of per-port traffic statistics. To access the Port Detailed page: 1. Click the Monitoring Ports tab, and then click Port Detailed Statistics. (Figure 6-3 on page 6-6 shows some, but not all, of the fields on the Port Detailed Statistics page.) Monitoring the System 6-5 v1.0, July 2009
-
 1
1 -
2
-
3
-
4
-
5
-
6
-
7
-
8
-
9
-
10
-
11
-
12
-
13
-
14
-
15
-
16
-
17
-
18
-
19
-
20
-
21
-
22
-
23
-
24
-
25
-
26
-
27
-
28
-
29
-
30
-
31
-
32
-
33
-
34
-
35
-
36
-
37
-
38
-
39
-
40
-
41
-
42
-
43
-
44
-
45
-
46
-
47
-
48
-
49
-
50
-
51
-
52
-
53
-
54
-
55
-
56
-
57
-
58
-
59
-
60
-
61
-
62
-
63
-
64
-
65
-
66
-
67
-
68
-
69
-
70
-
71
-
72
-
73
-
74
-
75
-
76
-
77
-
78
-
79
-
80
-
81
-
82
-
83
-
84
-
85
-
86
-
87
-
88
-
89
-
90
-
91
-
92
-
93
-
94
-
95
-
96
-
97
-
98
-
99
-
100
-
101
-
102
-
103
-
104
-
105
-
106
-
107
-
108
-
109
-
110
-
111
-
112
-
113
-
114
-
115
-
116
-
117
-
118
-
119
-
120
-
121
-
122
-
123
-
124
-
125
-
126
-
127
-
128
-
129
-
130
-
131
-
132
-
133
-
134
-
135
-
136
-
137
-
138
-
139
-
140
-
141
-
142
-
143
-
144
-
145
-
146
-
147
-
148
-
149
-
150
-
151
-
152
-
153
-
154
-
155
-
156
-
157
-
158
-
159
-
160
-
161
-
162
-
163
-
164
-
165
-
166
-
167
-
168
-
169
-
170
-
171
-
172
-
173
-
174
-
175
-
176
-
177
-
178
-
179
-
180
-
181
-
 182
182 -
 183
183 -
 184
184 -
 185
185 -
 186
186 -
 187
187 -
 188
188 -
 189
189 -
 190
190 -
 191
191 -
 192
192 -
193
-
194
-
195
-
196
-
197
-
198
-
199
-
200
-
201
-
202
-
203
-
204
-
205
-
206
-
207
-
208
-
209
-
210
-
211
-
212
-
213
-
214
-
215
-
216
-
217
-
218
-
219
-
220
-
221
-
222
-
223
-
224
-
225
-
226
-
227
-
228
-
229
-
230
-
231
-
232
-
233
-
234
-
235
-
236
-
237
-
238
-
239
-
240
-
241
-
242
-
243
-
244
-
245
-
246
 |
 |
