Netgear GS716Tv2 GS716Tv2/GS724Tv3 Software Admin Manual - Page 196
Managing Logs, Memory Logs
 |
View all Netgear GS716Tv2 manuals
Add to My Manuals
Save this manual to your list of manuals |
Page 196 highlights
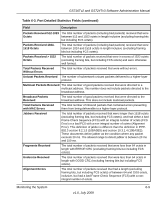
GS716Tv2 and GS724Tv3 Software Administration Manual Table 6-4. EAP Statistics Fields (continued) Field Description Request/ID Frames Transmitted Displays the number of EAP Requested ID frames transmitted through the port. Request Frames Transmitted Displays the number of EAP Request frames transmitted through the port. 2. To clear all the EAP counters for all ports on the switch, select the check box in the row heading and click Clear. The button resets all statistics for all ports to default values. 3. To clear the counters for a specific port, select the check box associated with the port and click Clear. 4. Click Refresh to refresh the data on the screen and display the most current statistics. Managing Logs The switch may generate messages in response to events, faults, or errors occurring on the platform as well as changes in configuration or other occurrences. These messages are stored locally and can be forwarded to one or more centralized points of collection for monitoring purposes or long term archival storage. Local and remote configuration of the logging capability includes filtering of messages logged or forwarded based on severity and generating component. The Monitoring Logs tab contains links to the following folders: • "Memory Logs" on page 6-14 • "FLASH Log Configuration" on page 6-16 • "Server Log Configuration" on page 6-19 • "Trap Logs" on page 6-21 • "Event Logs" on page 6-22 Memory Logs The in-memory log stores messages in memory based upon the settings for message component and severity. Use the Memory Logs page to set the administrative status and behavior of logs in the system buffer. To access the Memory Log page: 1. Click the Monitoring Logs tab, and then click the Memory Log link. 6-14 v1.0, July 2009 Monitoring the System
-
 1
1 -
2
-
3
-
4
-
5
-
6
-
7
-
8
-
9
-
10
-
11
-
12
-
13
-
14
-
15
-
16
-
17
-
18
-
19
-
20
-
21
-
22
-
23
-
24
-
25
-
26
-
27
-
28
-
29
-
30
-
31
-
32
-
33
-
34
-
35
-
36
-
37
-
38
-
39
-
40
-
41
-
42
-
43
-
44
-
45
-
46
-
47
-
48
-
49
-
50
-
51
-
52
-
53
-
54
-
55
-
56
-
57
-
58
-
59
-
60
-
61
-
62
-
63
-
64
-
65
-
66
-
67
-
68
-
69
-
70
-
71
-
72
-
73
-
74
-
75
-
76
-
77
-
78
-
79
-
80
-
81
-
82
-
83
-
84
-
85
-
86
-
87
-
88
-
89
-
90
-
91
-
92
-
93
-
94
-
95
-
96
-
97
-
98
-
99
-
100
-
101
-
102
-
103
-
104
-
105
-
106
-
107
-
108
-
109
-
110
-
111
-
112
-
113
-
114
-
115
-
116
-
117
-
118
-
119
-
120
-
121
-
122
-
123
-
124
-
125
-
126
-
127
-
128
-
129
-
130
-
131
-
132
-
133
-
134
-
135
-
136
-
137
-
138
-
139
-
140
-
141
-
142
-
143
-
144
-
145
-
146
-
147
-
148
-
149
-
150
-
151
-
152
-
153
-
154
-
155
-
156
-
157
-
158
-
159
-
160
-
161
-
162
-
163
-
164
-
165
-
166
-
167
-
168
-
169
-
170
-
171
-
172
-
173
-
174
-
175
-
176
-
177
-
178
-
179
-
180
-
181
-
182
-
183
-
184
-
185
-
186
-
187
-
188
-
189
-
190
-
 191
191 -
 192
192 -
 193
193 -
 194
194 -
 195
195 -
 196
196 -
 197
197 -
 198
198 -
 199
199 -
 200
200 -
 201
201 -
202
-
203
-
204
-
205
-
206
-
207
-
208
-
209
-
210
-
211
-
212
-
213
-
214
-
215
-
216
-
217
-
218
-
219
-
220
-
221
-
222
-
223
-
224
-
225
-
226
-
227
-
228
-
229
-
230
-
231
-
232
-
233
-
234
-
235
-
236
-
237
-
238
-
239
-
240
-
241
-
242
-
243
-
244
-
245
-
246
 |
 |
