HP rp3440 User Service Guide, Sixth Edition - HP 9000 rp3410/rp3440 - Page 116
Troubleshooting Using Offline Support Tools, Offline Diagnostic Environment
 |
View all HP rp3440 manuals
Add to My Manuals
Save this manual to your list of manuals |
Page 116 highlights
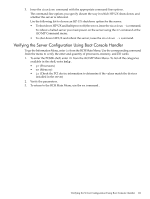
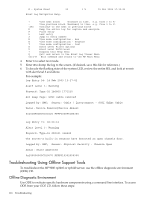
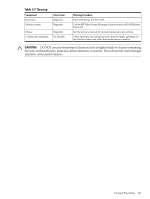
E - System Event 39 Event Log Navigation Help: 3 % 01 Nov 2004 17:15:03 + D F L J H K T A U ? Q Ctrl-B View next block (forward in time, e.g. from 3 to 4) View previous block (backward in time, e.g. from 3 to 2) Continue to the next or previous block Dump the entire log for capture and analysis First entry Last entry Jump to entry number View mode configuration - hex View mode configuration - keyword View mode configuration - text Alert Level Filter options Alert Level Unfiltered Display this Help menu Quit and return to the Event Log Viewer Menu Exit command and return to the MP Main Menu 4. Enter t to select text mode. 5. Enter d to dump the log to the screen. (If desired, save this file for reference.) 6. To decode the flashing state of the system LED, review the entire SEL and look at events with alert level 3 and above. For example: Log Entry 24: 14 Feb 2003 15:27:02 Alert Level 3: Warning Keyword: Type-02 1b0800 1771520 Hot Swap Cage: SCSI cable removed Logged by: BMC; Sensor: Cable / Interconnect - SCSI ChExt Cable Data1: Device Removed/Device Absent 0x203E4D0AC6020220 FFFF0008F61B0300 Log Entry 73: 00:00:12 Alert Level 3: Warning Keyword: Type-02 050301 328449 The server's built-in sensors have detected an open chassis door. Logged by: BMC; Sensor: Physical Security - Chassis Open Data1: State Asserted 0x200000000C020570 FFFF010302050300 Troubleshooting Using Offline Support Tools To troubleshoot the HP 9000 rp3410 or rp3440 server, use the offline diagnostic environment (ODE) CD. Offline Diagnostic Environment Use ODE to evaluate specific hardware components using a command line interface. To access ODE from your ODE CD, follow these steps: 116 Troubleshooting
-
 1
1 -
2
-
3
-
4
-
5
-
6
-
7
-
8
-
9
-
10
-
11
-
12
-
13
-
14
-
15
-
16
-
17
-
18
-
19
-
20
-
21
-
22
-
23
-
24
-
25
-
26
-
27
-
28
-
29
-
30
-
31
-
32
-
33
-
34
-
35
-
36
-
37
-
38
-
39
-
40
-
41
-
42
-
43
-
44
-
45
-
46
-
47
-
48
-
49
-
50
-
51
-
52
-
53
-
54
-
55
-
56
-
57
-
58
-
59
-
60
-
61
-
62
-
63
-
64
-
65
-
66
-
67
-
68
-
69
-
70
-
71
-
72
-
73
-
74
-
75
-
76
-
77
-
78
-
79
-
80
-
81
-
82
-
83
-
84
-
85
-
86
-
87
-
88
-
89
-
90
-
91
-
92
-
93
-
94
-
95
-
96
-
97
-
98
-
99
-
100
-
101
-
102
-
103
-
104
-
105
-
106
-
107
-
108
-
109
-
110
-
 111
111 -
 112
112 -
 113
113 -
 114
114 -
 115
115 -
 116
116 -
 117
117 -
 118
118 -
 119
119 -
 120
120 -
 121
121 -
122
-
123
-
124
-
125
-
126
-
127
-
128
-
129
-
130
-
131
-
132
-
133
-
134
-
135
-
136
-
137
-
138
-
139
-
140
-
141
-
142
-
143
-
144
-
145
-
146
-
147
-
148
-
149
-
150
-
151
-
152
-
153
-
154
-
155
-
156
-
157
-
158
-
159
-
160
-
161
-
162
-
163
-
164
-
165
-
166
-
167
-
168
-
169
-
170
-
171
-
172
-
173
-
174
-
175
-
176
-
177
-
178
-
179
-
180
-
181
-
182
-
183
-
184
-
185
-
186
-
187
-
188
-
189
-
190
-
191
-
192
-
193
-
194
-
195
-
196
-
197
-
198
-
199
-
200
-
201
-
202
-
203
-
204
-
205
-
206
-
207
-
208
-
209
-
210
 |
 |