Netgear GS724Tv4 Software Administration Manual - Page 230
Port Statistics, To access the port summary screen, Monitoring, Ports
 |
View all Netgear GS724Tv4 manuals
Add to My Manuals
Save this manual to your list of manuals |
Page 230 highlights
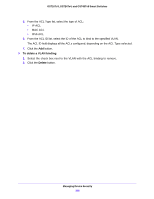
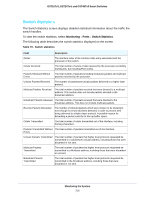
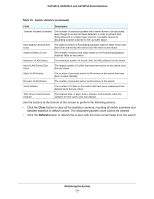
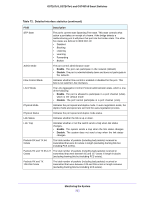
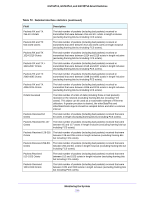
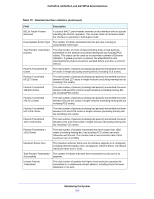
GS716Tv3, GS724Tv4, and GS748Tv5 Smart Switches Port Statistics The Port Statistics screen displays a summary of per-port traffic statistics on the switch. To access the port summary screen: 1. Select Monitoring > Ports > Port Statistics. 2. Select whether to display physical interfaces, link aggregation groups (LAGs), or both by clicking one of the following links above the table heading: • 1 (or the unit ID of the switch). Only physical interfaces are displayed. This is the default setting. • LAGS. Only link aggregation groups are displayed. • All. Both physical interfaces and link aggregation groups are displayed. To locate an interface quickly, type the interface number (for example, g1) in the Go To Interface field at the top or bottom of the table and click the Go button. The following table describes the per-port statistics displayed on the screen. Table 71. Port statistics Field Interface Description Lists the ports on the system. Total Packets Received Without Errors The total number of packets received that were without errors. Packets Received With Error The number of inbound packets that contained errors preventing them from being deliverable to a higher layer protocol. Broadcast Packets Received The total number of good packets received that were directed to the broadcast address. This does not include multicast packets. Packets Transmitted Without The number of frames that have been transmitted by this port to its segment. Errors Transmit Packet Errors The number of outbound packets that could not be transmitted because of errors. Collision Frames The best estimate of the total number of collisions on this Ethernet segment. Time Since Counters Last Cleared The elapsed time, in days, hours, minutes, and seconds since the statistics for this port were last cleared. To reset the counters for all interfaces on the switch: 1. Select the check box in the heading of the table. 2. Click the Clear button. Monitoring the System 230
-
 1
1 -
2
-
3
-
4
-
5
-
6
-
7
-
8
-
9
-
10
-
11
-
12
-
13
-
14
-
15
-
16
-
17
-
18
-
19
-
20
-
21
-
22
-
23
-
24
-
25
-
26
-
27
-
28
-
29
-
30
-
31
-
32
-
33
-
34
-
35
-
36
-
37
-
38
-
39
-
40
-
41
-
42
-
43
-
44
-
45
-
46
-
47
-
48
-
49
-
50
-
51
-
52
-
53
-
54
-
55
-
56
-
57
-
58
-
59
-
60
-
61
-
62
-
63
-
64
-
65
-
66
-
67
-
68
-
69
-
70
-
71
-
72
-
73
-
74
-
75
-
76
-
77
-
78
-
79
-
80
-
81
-
82
-
83
-
84
-
85
-
86
-
87
-
88
-
89
-
90
-
91
-
92
-
93
-
94
-
95
-
96
-
97
-
98
-
99
-
100
-
101
-
102
-
103
-
104
-
105
-
106
-
107
-
108
-
109
-
110
-
111
-
112
-
113
-
114
-
115
-
116
-
117
-
118
-
119
-
120
-
121
-
122
-
123
-
124
-
125
-
126
-
127
-
128
-
129
-
130
-
131
-
132
-
133
-
134
-
135
-
136
-
137
-
138
-
139
-
140
-
141
-
142
-
143
-
144
-
145
-
146
-
147
-
148
-
149
-
150
-
151
-
152
-
153
-
154
-
155
-
156
-
157
-
158
-
159
-
160
-
161
-
162
-
163
-
164
-
165
-
166
-
167
-
168
-
169
-
170
-
171
-
172
-
173
-
174
-
175
-
176
-
177
-
178
-
179
-
180
-
181
-
182
-
183
-
184
-
185
-
186
-
187
-
188
-
189
-
190
-
191
-
192
-
193
-
194
-
195
-
196
-
197
-
198
-
199
-
200
-
201
-
202
-
203
-
204
-
205
-
206
-
207
-
208
-
209
-
210
-
211
-
212
-
213
-
214
-
215
-
216
-
217
-
218
-
219
-
220
-
221
-
222
-
223
-
224
-
 225
225 -
 226
226 -
 227
227 -
 228
228 -
 229
229 -
 230
230 -
 231
231 -
 232
232 -
 233
233 -
 234
234 -
 235
235 -
236
-
237
-
238
-
239
-
240
-
241
-
242
-
243
-
244
-
245
-
246
-
247
-
248
-
249
-
250
-
251
-
252
-
253
-
254
-
255
-
256
-
257
-
258
-
259
-
260
-
261
-
262
-
263
-
264
-
265
-
266
-
267
-
268
-
269
-
270
-
271
-
272
-
273
-
274
-
275
-
276
-
277
-
278
-
279
-
280
-
281
-
282
-
283
-
284
-
285
-
286
-
287
-
288
-
289
-
290
 |
 |