HP StorageWorks 2/16V Brocade Web Tools Administrator's Guide (53-0000194-01, - Page 180
Predefined Performance Graphs, Cascade, Close All, Admin Domain considerations
 |
View all HP StorageWorks 2/16V manuals
Add to My Manuals
Save this manual to your list of manuals |
Page 180 highlights
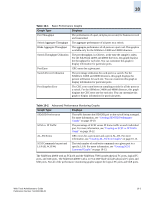
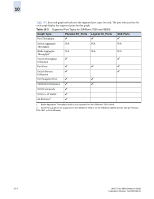
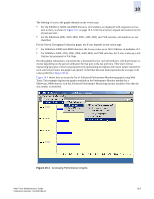
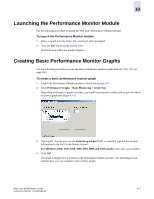
10 Each graph is displayed individually in a window, so it can be minimized, maximized, resized, and closed. Graphs within the Performance Monitor module are updated every 30 seconds. When you first display the graph or if you modify the graph (such as to add additional ports), you might have to wait up to 30 seconds before the new values are shown. When you have multiple graphs open in the Performance Monitor module, you can: • Select Tile from the Window menu to view all graphs at once, tiled in the Performance Monitor module. • Select Cascade from the Window menu to view one graph at a time. • Select Close All to close all open Performance Monitor graphs in the Performance Monitor module. In addition, the Window menu lists all open graphs. You can select a graph name from the Window menu to bring that graph to the front view when the graphs are cascaded, and to select the window for that graph when the graphs are tiled. Admin Domain considerations: • If you are not the switch owner, you will see the following ports: - E_ports, including EX_Ports - directly owned ports - indirect ports • You can use the Advanced Performance Monitoring feature only in AD255 or in AD0 if there are no other user-defined Admin Domains. Otherwise, access to Advanced Monitoring features in the Performance Graphs menu will be grayed out. • It is recommended that you define a user with a SwitchAdmin role and give that user access to AD255 for the purpose of data collecting using the Advanced Performance Monitor. Predefined Performance Graphs Web Tools predefines basic graph types, to simplify performance monitoring. A wide range of end-toend fabric, LUN, device, and port metrics graphs are included. Table 10-1 lists the basic monitoring graphs available. Table 10-2 on page 10-3 lists the advanced monitoring graphs. The advanced monitoring graphs give more detailed performance information to help you manage your fabric. You can access the basic monitoring graphs on all switches; advanced monitoring graphs are available only on switches that have a Brocade Advanced Performance Monitoring license activated. 10-2 Web Tools Administrator's Guide Publication Number: 53-0000194-01
-
 1
1 -
2
-
3
-
4
-
5
-
6
-
7
-
8
-
9
-
10
-
11
-
12
-
13
-
14
-
15
-
16
-
17
-
18
-
19
-
20
-
21
-
22
-
23
-
24
-
25
-
26
-
27
-
28
-
29
-
30
-
31
-
32
-
33
-
34
-
35
-
36
-
37
-
38
-
39
-
40
-
41
-
42
-
43
-
44
-
45
-
46
-
47
-
48
-
49
-
50
-
51
-
52
-
53
-
54
-
55
-
56
-
57
-
58
-
59
-
60
-
61
-
62
-
63
-
64
-
65
-
66
-
67
-
68
-
69
-
70
-
71
-
72
-
73
-
74
-
75
-
76
-
77
-
78
-
79
-
80
-
81
-
82
-
83
-
84
-
85
-
86
-
87
-
88
-
89
-
90
-
91
-
92
-
93
-
94
-
95
-
96
-
97
-
98
-
99
-
100
-
101
-
102
-
103
-
104
-
105
-
106
-
107
-
108
-
109
-
110
-
111
-
112
-
113
-
114
-
115
-
116
-
117
-
118
-
119
-
120
-
121
-
122
-
123
-
124
-
125
-
126
-
127
-
128
-
129
-
130
-
131
-
132
-
133
-
134
-
135
-
136
-
137
-
138
-
139
-
140
-
141
-
142
-
143
-
144
-
145
-
146
-
147
-
148
-
149
-
150
-
151
-
152
-
153
-
154
-
155
-
156
-
157
-
158
-
159
-
160
-
161
-
162
-
163
-
164
-
165
-
166
-
167
-
168
-
169
-
170
-
171
-
172
-
173
-
174
-
 175
175 -
 176
176 -
 177
177 -
 178
178 -
 179
179 -
 180
180 -
 181
181 -
 182
182 -
 183
183 -
 184
184 -
 185
185 -
186
-
187
-
188
-
189
-
190
-
191
-
192
-
193
-
194
-
195
-
196
-
197
-
198
-
199
-
200
-
201
-
202
-
203
-
204
-
205
-
206
-
207
-
208
-
209
-
210
-
211
-
212
-
213
-
214
-
215
-
216
-
217
-
218
-
219
-
220
-
221
-
222
-
223
-
224
-
225
-
226
-
227
-
228
-
229
-
230
-
231
-
232
-
233
-
234
-
235
-
236
-
237
-
238
-
239
-
240
-
241
-
242
-
243
-
244
-
245
-
246
-
247
-
248
-
249
-
250
-
251
-
252
-
253
-
254
-
255
-
256
-
257
-
258
-
259
-
260
-
261
-
262
-
263
-
264
-
265
-
266
-
267
-
268
-
269
-
270
-
271
-
272
-
273
-
274
-
275
-
276
-
277
-
278
-
279
-
280
-
281
-
282
-
283
-
284
-
285
-
286
-
287
-
288
-
289
-
290
-
291
-
292
-
293
-
294
-
295
-
296
-
297
-
298
-
299
-
300
-
301
-
302
-
303
-
304
-
305
-
306
-
307
-
308
 |
 |
