HP StorageWorks 2/16V Brocade Web Tools Administrator's Guide (53-0000194-01, - Page 54
Switch Information View, Status Legend, AD/User/Role Indicator, Displaying Tool Tips
 |
View all HP StorageWorks 2/16V manuals
Add to My Manuals
Save this manual to your list of manuals |
Page 54 highlights
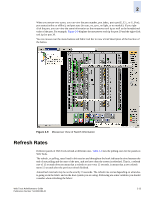
2 Switch Information View The Switch Information View displays vital switch information such as switch name, status, Fabric OS version, domain ID, IP address, WWN, and current zone configuration. The information in the Switch Information View is polled every 15 seconds. The Switch Information View is located beside the graphic representation of the switch for the SilkWorm 24000 and 48000 directors. For all other switch types (SilkWorm 200E, 3250, 3850, 3900, 4100, 4900, and 7500), the Switch Information View is located beneath the graphic representation of the switch. For more information, see "Displaying Switch Information" on page 12-4. Status Legend The Status Legend is included in the Switch Information View and defines the meaning of colors visible in the background of the various icons in the Switch Explorer. Each color indicates a different operational state: • Green: healthy • Yellow: marginal • Red: critical • Gray: unknown or unmonitored Note For all status displays based on errors per time interval, any errors cause the status to show faulty until the entire sample interval has passed. AD/User/Role Indicator The indicator bar is displayed in the lower-right corner of every module window. It tells you the Admin Domain you are currently in, the user name with which you logged in to the switch, and the role associated with your user account. Displaying Tool Tips You can move your mouse over various components in Web Tools Explorer and view information in tags about the object. Figure 2-9 shows several examples of tool tips. In the Fabric Tree you can mouse over a switch and display its type, Ethernet IP, Fibre Channel IP, and status of the switch. In the Switch View, you can mouse over a blade to view the blade ID and its status. It is easier to use the top of the blade to display the tool tip so that you do not inadvertently display the port tool tips. 2-12 Web Tools Administrator's Guide Publication Number: 53-0000194-01
-
 1
1 -
2
-
3
-
4
-
5
-
6
-
7
-
8
-
9
-
10
-
11
-
12
-
13
-
14
-
15
-
16
-
17
-
18
-
19
-
20
-
21
-
22
-
23
-
24
-
25
-
26
-
27
-
28
-
29
-
30
-
31
-
32
-
33
-
34
-
35
-
36
-
37
-
38
-
39
-
40
-
41
-
42
-
43
-
44
-
45
-
46
-
47
-
48
-
 49
49 -
 50
50 -
 51
51 -
 52
52 -
 53
53 -
 54
54 -
 55
55 -
 56
56 -
 57
57 -
 58
58 -
 59
59 -
60
-
61
-
62
-
63
-
64
-
65
-
66
-
67
-
68
-
69
-
70
-
71
-
72
-
73
-
74
-
75
-
76
-
77
-
78
-
79
-
80
-
81
-
82
-
83
-
84
-
85
-
86
-
87
-
88
-
89
-
90
-
91
-
92
-
93
-
94
-
95
-
96
-
97
-
98
-
99
-
100
-
101
-
102
-
103
-
104
-
105
-
106
-
107
-
108
-
109
-
110
-
111
-
112
-
113
-
114
-
115
-
116
-
117
-
118
-
119
-
120
-
121
-
122
-
123
-
124
-
125
-
126
-
127
-
128
-
129
-
130
-
131
-
132
-
133
-
134
-
135
-
136
-
137
-
138
-
139
-
140
-
141
-
142
-
143
-
144
-
145
-
146
-
147
-
148
-
149
-
150
-
151
-
152
-
153
-
154
-
155
-
156
-
157
-
158
-
159
-
160
-
161
-
162
-
163
-
164
-
165
-
166
-
167
-
168
-
169
-
170
-
171
-
172
-
173
-
174
-
175
-
176
-
177
-
178
-
179
-
180
-
181
-
182
-
183
-
184
-
185
-
186
-
187
-
188
-
189
-
190
-
191
-
192
-
193
-
194
-
195
-
196
-
197
-
198
-
199
-
200
-
201
-
202
-
203
-
204
-
205
-
206
-
207
-
208
-
209
-
210
-
211
-
212
-
213
-
214
-
215
-
216
-
217
-
218
-
219
-
220
-
221
-
222
-
223
-
224
-
225
-
226
-
227
-
228
-
229
-
230
-
231
-
232
-
233
-
234
-
235
-
236
-
237
-
238
-
239
-
240
-
241
-
242
-
243
-
244
-
245
-
246
-
247
-
248
-
249
-
250
-
251
-
252
-
253
-
254
-
255
-
256
-
257
-
258
-
259
-
260
-
261
-
262
-
263
-
264
-
265
-
266
-
267
-
268
-
269
-
270
-
271
-
272
-
273
-
274
-
275
-
276
-
277
-
278
-
279
-
280
-
281
-
282
-
283
-
284
-
285
-
286
-
287
-
288
-
289
-
290
-
291
-
292
-
293
-
294
-
295
-
296
-
297
-
298
-
299
-
300
-
301
-
302
-
303
-
304
-
305
-
306
-
307
-
308
 |
 |
