HP StorageWorks 2/16V Brocade Web Tools Administrator's Guide (53-0000194-01, - Page 56
Displaying Switches in the Fabric
 |
View all HP StorageWorks 2/16V manuals
Add to My Manuals
Save this manual to your list of manuals |
Page 56 highlights
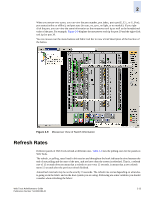
2 Retrieval time increases when you are in a large fabric as there is more data to fetch from the switch(s). • Processor speed of the system you are using may slow down the refresh rate. • OS-Job Scheduling if you are using a host-system in the data center impacts the refresh rate • JVM-Performance can contribute to causing interval differences between what is on-screen and how long it is actually taking. For these reasons, you might see that the time displayed in the port statistics tab isn't refreshed as expected. The counter time indicates only that "this statistics data is retrieved from the switch in this time." This is the reason the time field is updated along with the port statistics data after every refresh. The lag in refresh rate is more evident in the iSCSI Target Gateway module. Table 2-1 Polling Rates Module Polling Rate Name Server Zoning Database Fabric Watch Performance Monitor Port Management User-defined; 15 sec minimum 60 sec 15 sec 30 sec 2 min FC Routing 30-90 sec, depending on network traffic Displaying Switches in the Fabric If your fabric has more than one switch, you can launch Web Tools from one switch and then access other switches. You should not launch switches running Fabric OS v4.4.x or higher from a fabric tree displayed for a pre-v4.4.x switch, as some features might be disabled. To access the Switch Explorer for a particular switch 1. Launch Web Tools as described in "Launching Web Tools" on page 1-8 and log in to the switch The Switch Explorer is displayed for the switch you logged in to. The Fabric Tree is expanded by default when you first launch Web Tools. 2. If the Fabric Tree is not expanded, click the plus sign (+) in the Fabric Tree to view all the switches in the fabric. 3. Click a switch in the Fabric Tree. A separate browser window opens and displays the selected switch. (If the launch switch is running a Fabric OS version earlier than v5.0.1, the selected switch displays in the same browser window.) The graphic of the selected switch is displayed in the Switch View. Additional switch information is displayed in the Switch Information View. 2-14 Web Tools Administrator's Guide Publication Number: 53-0000194-01
-
 1
1 -
2
-
3
-
4
-
5
-
6
-
7
-
8
-
9
-
10
-
11
-
12
-
13
-
14
-
15
-
16
-
17
-
18
-
19
-
20
-
21
-
22
-
23
-
24
-
25
-
26
-
27
-
28
-
29
-
30
-
31
-
32
-
33
-
34
-
35
-
36
-
37
-
38
-
39
-
40
-
41
-
42
-
43
-
44
-
45
-
46
-
47
-
48
-
49
-
50
-
 51
51 -
 52
52 -
 53
53 -
 54
54 -
 55
55 -
 56
56 -
 57
57 -
 58
58 -
 59
59 -
 60
60 -
 61
61 -
62
-
63
-
64
-
65
-
66
-
67
-
68
-
69
-
70
-
71
-
72
-
73
-
74
-
75
-
76
-
77
-
78
-
79
-
80
-
81
-
82
-
83
-
84
-
85
-
86
-
87
-
88
-
89
-
90
-
91
-
92
-
93
-
94
-
95
-
96
-
97
-
98
-
99
-
100
-
101
-
102
-
103
-
104
-
105
-
106
-
107
-
108
-
109
-
110
-
111
-
112
-
113
-
114
-
115
-
116
-
117
-
118
-
119
-
120
-
121
-
122
-
123
-
124
-
125
-
126
-
127
-
128
-
129
-
130
-
131
-
132
-
133
-
134
-
135
-
136
-
137
-
138
-
139
-
140
-
141
-
142
-
143
-
144
-
145
-
146
-
147
-
148
-
149
-
150
-
151
-
152
-
153
-
154
-
155
-
156
-
157
-
158
-
159
-
160
-
161
-
162
-
163
-
164
-
165
-
166
-
167
-
168
-
169
-
170
-
171
-
172
-
173
-
174
-
175
-
176
-
177
-
178
-
179
-
180
-
181
-
182
-
183
-
184
-
185
-
186
-
187
-
188
-
189
-
190
-
191
-
192
-
193
-
194
-
195
-
196
-
197
-
198
-
199
-
200
-
201
-
202
-
203
-
204
-
205
-
206
-
207
-
208
-
209
-
210
-
211
-
212
-
213
-
214
-
215
-
216
-
217
-
218
-
219
-
220
-
221
-
222
-
223
-
224
-
225
-
226
-
227
-
228
-
229
-
230
-
231
-
232
-
233
-
234
-
235
-
236
-
237
-
238
-
239
-
240
-
241
-
242
-
243
-
244
-
245
-
246
-
247
-
248
-
249
-
250
-
251
-
252
-
253
-
254
-
255
-
256
-
257
-
258
-
259
-
260
-
261
-
262
-
263
-
264
-
265
-
266
-
267
-
268
-
269
-
270
-
271
-
272
-
273
-
274
-
275
-
276
-
277
-
278
-
279
-
280
-
281
-
282
-
283
-
284
-
285
-
286
-
287
-
288
-
289
-
290
-
291
-
292
-
293
-
294
-
295
-
296
-
297
-
298
-
299
-
300
-
301
-
302
-
303
-
304
-
305
-
306
-
307
-
308
 |
 |
