HP StorageWorks 2/16V Brocade Web Tools Administrator's Guide (53-0000194-01, - Page 187
Select Ports, For the SilkWorm 24000 and 48000 directors, ADD ALL Ports, Search, Apply,
 |
View all HP StorageWorks 2/16V manuals
Add to My Manuals
Save this manual to your list of manuals |
Page 187 highlights
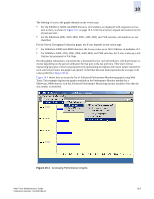
10 3. To display detailed port throughput utilization rates for particular ports only, right-click anywhere in the graph.and click Select Ports. The setup dialog box displays, as shown in Figure 10-3. The title of the dialog box varies, depending on the type of graph you are customizing, but the layout of the dialog box is the same. Figure 10-3 shows an example of the setup dialog box for the Switch Throughput Utilization graph. Figure 10-3 Switch Throughput Utilization Setup Dialog Box 4. You can perform the following in the dialog box: a. Double-click the domain icon to expand the slot/port list. For the SilkWorm 24000 and 48000 directors, click the + signs to expand the ports under each slot, as shown in Figure 10-3. b. Click the particular port you want to monitor in the graph in the Port Selection List. Use Shiftclick and Ctrl-click to select multiple ports. c. Click Add to move the selected ports to the Selected Ports list. d. Optional: Click ADD ALL Ports to add all of the ports in the Port Selection List to the Selected Ports list. e. Optional: Click Search to launch the Search Port Selection List dialog box, from which you can search for all E_Ports, all F_Ports, or all port names with a defined string. Select the ports you want to add and click Search in the Search Port Selection List dialog box. f. Click Apply. Only the selected ports are displayed in the graph. Web Tools Administrator's Guide Publication Number: 53-0000194-01 10-9
-
 1
1 -
2
-
3
-
4
-
5
-
6
-
7
-
8
-
9
-
10
-
11
-
12
-
13
-
14
-
15
-
16
-
17
-
18
-
19
-
20
-
21
-
22
-
23
-
24
-
25
-
26
-
27
-
28
-
29
-
30
-
31
-
32
-
33
-
34
-
35
-
36
-
37
-
38
-
39
-
40
-
41
-
42
-
43
-
44
-
45
-
46
-
47
-
48
-
49
-
50
-
51
-
52
-
53
-
54
-
55
-
56
-
57
-
58
-
59
-
60
-
61
-
62
-
63
-
64
-
65
-
66
-
67
-
68
-
69
-
70
-
71
-
72
-
73
-
74
-
75
-
76
-
77
-
78
-
79
-
80
-
81
-
82
-
83
-
84
-
85
-
86
-
87
-
88
-
89
-
90
-
91
-
92
-
93
-
94
-
95
-
96
-
97
-
98
-
99
-
100
-
101
-
102
-
103
-
104
-
105
-
106
-
107
-
108
-
109
-
110
-
111
-
112
-
113
-
114
-
115
-
116
-
117
-
118
-
119
-
120
-
121
-
122
-
123
-
124
-
125
-
126
-
127
-
128
-
129
-
130
-
131
-
132
-
133
-
134
-
135
-
136
-
137
-
138
-
139
-
140
-
141
-
142
-
143
-
144
-
145
-
146
-
147
-
148
-
149
-
150
-
151
-
152
-
153
-
154
-
155
-
156
-
157
-
158
-
159
-
160
-
161
-
162
-
163
-
164
-
165
-
166
-
167
-
168
-
169
-
170
-
171
-
172
-
173
-
174
-
175
-
176
-
177
-
178
-
179
-
180
-
181
-
 182
182 -
 183
183 -
 184
184 -
 185
185 -
 186
186 -
 187
187 -
 188
188 -
 189
189 -
 190
190 -
 191
191 -
 192
192 -
193
-
194
-
195
-
196
-
197
-
198
-
199
-
200
-
201
-
202
-
203
-
204
-
205
-
206
-
207
-
208
-
209
-
210
-
211
-
212
-
213
-
214
-
215
-
216
-
217
-
218
-
219
-
220
-
221
-
222
-
223
-
224
-
225
-
226
-
227
-
228
-
229
-
230
-
231
-
232
-
233
-
234
-
235
-
236
-
237
-
238
-
239
-
240
-
241
-
242
-
243
-
244
-
245
-
246
-
247
-
248
-
249
-
250
-
251
-
252
-
253
-
254
-
255
-
256
-
257
-
258
-
259
-
260
-
261
-
262
-
263
-
264
-
265
-
266
-
267
-
268
-
269
-
270
-
271
-
272
-
273
-
274
-
275
-
276
-
277
-
278
-
279
-
280
-
281
-
282
-
283
-
284
-
285
-
286
-
287
-
288
-
289
-
290
-
291
-
292
-
293
-
294
-
295
-
296
-
297
-
298
-
299
-
300
-
301
-
302
-
303
-
304
-
305
-
306
-
307
-
308
 |
 |
