ZyXEL ENC User Guide - Page 167
Schedule Report
 |
View all ZyXEL ENC manuals
Add to My Manuals
Save this manual to your list of manuals |
Page 167 highlights
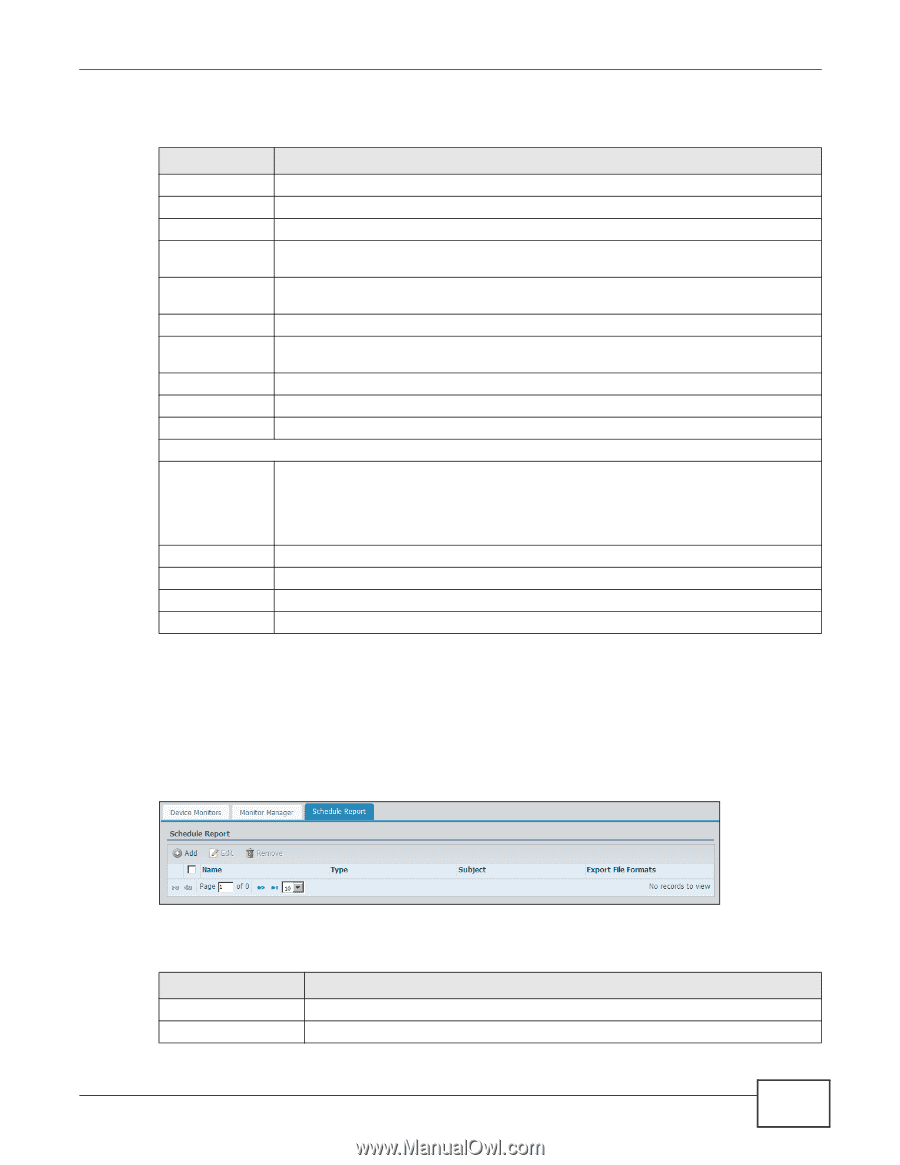
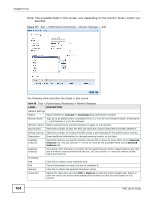
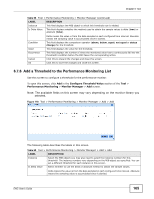
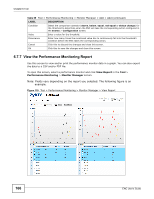
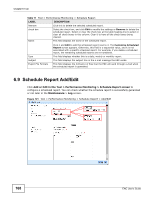
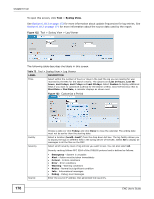
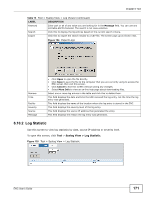
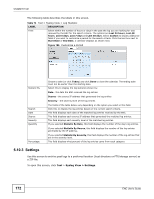
Chapter 6 Tool The following table describes the labels in this screen. Table 70 Tool > Performance Monitoring > Monitor Manager > View Report LABEL DESCRIPTION Generated at The field displays when this report was generated. Report: This field displays the name of the report you are viewing and the selected device's name. Print Click this to print this report out. PDF Click this to export the report to a PDF file on the computer you are using to access the ENC. CSV Click this to export the report to a CSV file on the computer you are using to access the ENC. Period Select how long ago the monitor's data that you are looking for was added to the ENC. Variable Select whether to show statistics about outgoing traffic only (Tx), incoming traffic only (Rx) or both incoming and outgoing traffic (Both) for the report. Search Click this to generate the monitor data based on your selected criteria. Save Settings Click this to save the customized settings for the graph being displayed in this screen. Tx/Rx Graph The graph shows statistics of the monitor based on the specified criteria. Tx/Rx Data Table check box Unselect this check box to not display the related statistic data in the graph. Select it again to display the data in the graph. Select or clear the check box at the table heading line to select or clear all check boxes in this column. Interface Name Min Max Avg Note: A graph can display up to five interfaces' data. This field displays the name of an instance on the device. This field displays the minimum value of this instance during the sampling period. This field displays the maximum value of this instance during the sampling period. This field displays the average value of this instance during the sampling period. 6.8 Schedule Report Click Tool > Performance Monitoring > Schedule Report to view the list of existing scheduled performance monitor reports for the device. Click Add to create a new schedule report. Figure 120 Tool > Performance Monitoring > Schedule Report Each field is described in the following table. Table 71 Tool > Performance Monitoring > Schedule Report LABEL DESCRIPTION Add Click this to create a daily, weekly or monthly report in a time interval. Edit Click this to modify an existing scheduled report. ENC User's Guide 167
-
 1
1 -
2
-
3
-
4
-
5
-
6
-
7
-
8
-
9
-
10
-
11
-
12
-
13
-
14
-
15
-
16
-
17
-
18
-
19
-
20
-
21
-
22
-
23
-
24
-
25
-
26
-
27
-
28
-
29
-
30
-
31
-
32
-
33
-
34
-
35
-
36
-
37
-
38
-
39
-
40
-
41
-
42
-
43
-
44
-
45
-
46
-
47
-
48
-
49
-
50
-
51
-
52
-
53
-
54
-
55
-
56
-
57
-
58
-
59
-
60
-
61
-
62
-
63
-
64
-
65
-
66
-
67
-
68
-
69
-
70
-
71
-
72
-
73
-
74
-
75
-
76
-
77
-
78
-
79
-
80
-
81
-
82
-
83
-
84
-
85
-
86
-
87
-
88
-
89
-
90
-
91
-
92
-
93
-
94
-
95
-
96
-
97
-
98
-
99
-
100
-
101
-
102
-
103
-
104
-
105
-
106
-
107
-
108
-
109
-
110
-
111
-
112
-
113
-
114
-
115
-
116
-
117
-
118
-
119
-
120
-
121
-
122
-
123
-
124
-
125
-
126
-
127
-
128
-
129
-
130
-
131
-
132
-
133
-
134
-
135
-
136
-
137
-
138
-
139
-
140
-
141
-
142
-
143
-
144
-
145
-
146
-
147
-
148
-
149
-
150
-
151
-
152
-
153
-
154
-
155
-
156
-
157
-
158
-
159
-
160
-
161
-
 162
162 -
 163
163 -
 164
164 -
 165
165 -
 166
166 -
 167
167 -
 168
168 -
 169
169 -
 170
170 -
 171
171 -
 172
172 -
173
-
174
-
175
-
176
-
177
-
178
-
179
-
180
-
181
-
182
-
183
-
184
-
185
-
186
-
187
-
188
-
189
-
190
-
191
-
192
-
193
-
194
-
195
-
196
-
197
-
198
-
199
-
200
-
201
-
202
-
203
-
204
-
205
-
206
-
207
-
208
-
209
-
210
-
211
-
212
-
213
-
214
-
215
-
216
-
217
-
218
-
219
-
220
-
221
-
222
-
223
-
224
-
225
-
226
-
227
-
228
-
229
-
230
-
231
-
232
-
233
-
234
-
235
-
236
-
237
-
238
-
239
-
240
-
241
-
242
-
243
-
244
-
245
-
246
-
247
-
248
-
249
-
250
-
251
-
252
-
253
-
254
-
255
-
256
-
257
-
258
-
259
-
260
-
261
-
262
-
263
-
264
-
265
-
266
-
267
-
268
-
269
-
270
-
271
-
272
-
273
-
274
-
275
-
276
-
277
-
278
-
279
-
280
-
281
-
282
-
283
-
284
-
285
-
286
-
287
-
288
-
289
-
290
-
291
-
292
-
293
-
294
-
295
-
296
-
297
-
298
-
299
-
300
-
301
-
302
-
303
-
304
-
305
-
306
-
307
-
308
-
309
-
310
-
311
-
312
-
313
-
314
-
315
-
316
-
317
-
318
-
319
-
320
-
321
-
322
-
323
-
324
-
325
-
326
-
327
-
328
-
329
-
330
-
331
-
332
-
333
-
334
-
335
-
336
-
337
-
338
-
339
-
340
-
341
-
342
-
343
-
344
-
345
-
346
-
347
-
348
-
349
-
350
-
351
-
352
-
353
-
354
-
355
-
356
-
357
-
358
-
359
-
360
-
361
-
362
-
363
-
364
-
365
-
366
-
367
-
368
-
369
-
370
-
371
-
372
-
373
-
374
-
375
-
376
-
377
-
378
-
379
-
380
-
381
-
382
-
383
-
384
-
385
-
386
-
387
-
388
-
389
-
390
 |
 |