ZyXEL ENC User Guide - Page 240
Table 117, LABEL, DESCRIPTION, Application, ENC User's Guide
 |
View all ZyXEL ENC manuals
Add to My Manuals
Save this manual to your list of manuals |
Page 240 highlights
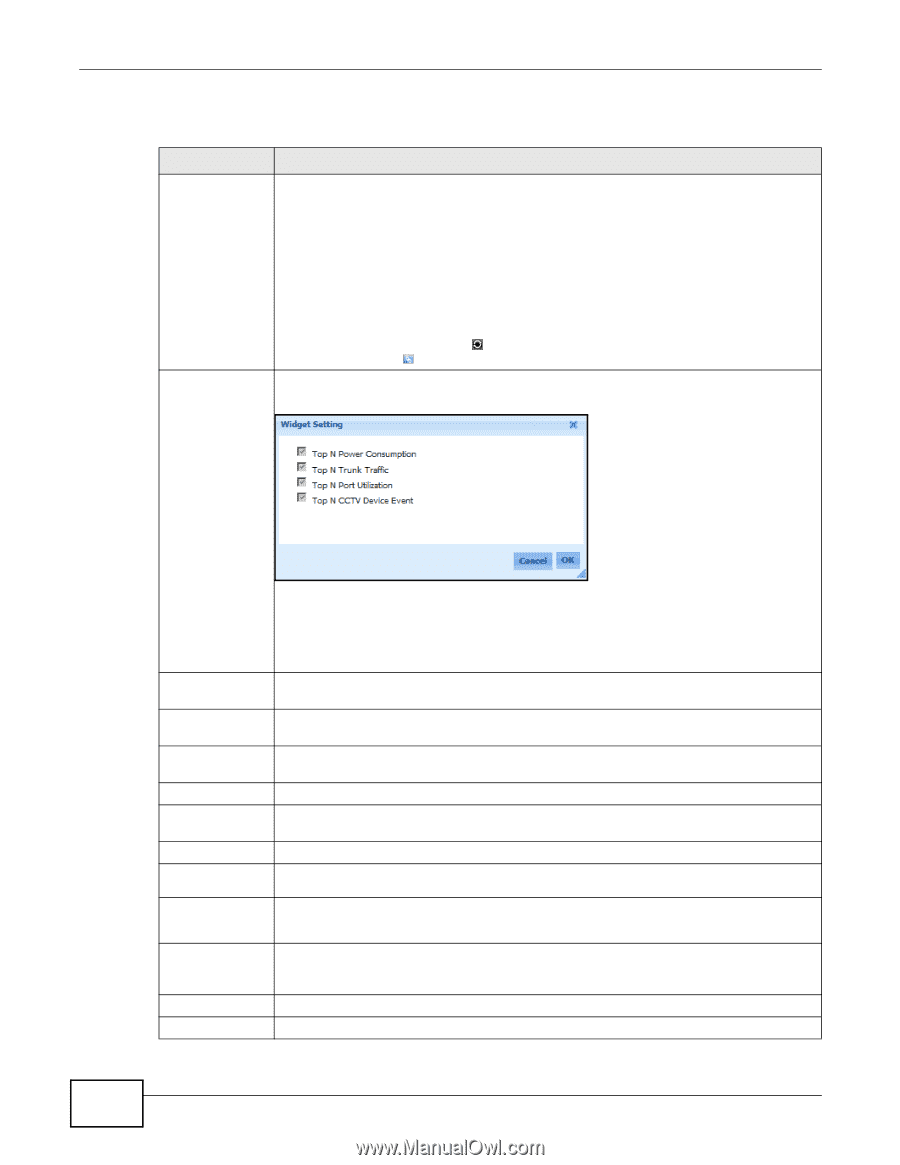
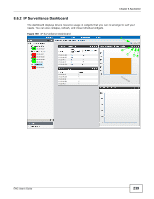
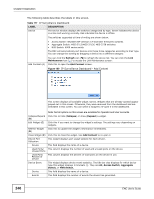
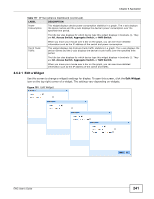
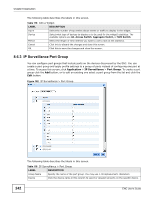
Chapter 8 Application The following table describes the labels in this screen. Table 117 IP Surveillance Dashboard LABEL DESCRIPTION Device The Device window displays the switches categorized by type. Green indicates the device is online and working normally. Red indicates the device is offline. The switches supported at time of writing are shown below: • Access Switch: GS2200-24P (Version 3.9 and later firmware) switches • Aggregate Switch: MGS-3712/MGS-3712F, MES-3728 switches • NVR Switch: 4000 series switch The ENC will automatically sort devices into these three categories according to their type. You can change this sorting by dragging a device into a different category. Add Content (A) You can click the Refresh icon ( ) to refresh the device list. You can click the Link Maintenance icon ( ) to access the Link Maintenance screen. Click this to open the Add Content screen. Figure 190 IP Surveillance Dashboard - Add Content This screen displays all available widget names. Widgets that are already opened appear grayed out in this screen. Otherwise, they were removed from the dashboard and are selectable in this screen. You can select a widget to re-open it in the dashboard. Note: Not all options on this screen are available for Operator and User accounts. Collapse/Expand Click this to hide (Collapse) or show (Expand) a widget. (B) Edit Widget (C) Click this if you want to change the widget's settings. The settings vary depending on widgets. Refresh Widget (D) Click this to update the widget's information immediately. Close Widget (E) Click this to close the widget. Use Add Content to re-open it. Device Port Utilization This widget displays port usage statistic for each device. Device This field displays the name of a device. Used Ports/ This column displays the number of used and unused ports on the device. Unused Ports Used Ports Percent of Device This column displays the percent of total ports on the device in use. Device Event This widget displays device event statistics. The title bar also displays for which device type this widget displays in brackets {}. They are All, Access Switch, Aggregate Switch, or NVR Switch. Device This field displays the name of a device. Events This field displays the number of events the device has generated. 240 ENC User's Guide
-
 1
1 -
2
-
3
-
4
-
5
-
6
-
7
-
8
-
9
-
10
-
11
-
12
-
13
-
14
-
15
-
16
-
17
-
18
-
19
-
20
-
21
-
22
-
23
-
24
-
25
-
26
-
27
-
28
-
29
-
30
-
31
-
32
-
33
-
34
-
35
-
36
-
37
-
38
-
39
-
40
-
41
-
42
-
43
-
44
-
45
-
46
-
47
-
48
-
49
-
50
-
51
-
52
-
53
-
54
-
55
-
56
-
57
-
58
-
59
-
60
-
61
-
62
-
63
-
64
-
65
-
66
-
67
-
68
-
69
-
70
-
71
-
72
-
73
-
74
-
75
-
76
-
77
-
78
-
79
-
80
-
81
-
82
-
83
-
84
-
85
-
86
-
87
-
88
-
89
-
90
-
91
-
92
-
93
-
94
-
95
-
96
-
97
-
98
-
99
-
100
-
101
-
102
-
103
-
104
-
105
-
106
-
107
-
108
-
109
-
110
-
111
-
112
-
113
-
114
-
115
-
116
-
117
-
118
-
119
-
120
-
121
-
122
-
123
-
124
-
125
-
126
-
127
-
128
-
129
-
130
-
131
-
132
-
133
-
134
-
135
-
136
-
137
-
138
-
139
-
140
-
141
-
142
-
143
-
144
-
145
-
146
-
147
-
148
-
149
-
150
-
151
-
152
-
153
-
154
-
155
-
156
-
157
-
158
-
159
-
160
-
161
-
162
-
163
-
164
-
165
-
166
-
167
-
168
-
169
-
170
-
171
-
172
-
173
-
174
-
175
-
176
-
177
-
178
-
179
-
180
-
181
-
182
-
183
-
184
-
185
-
186
-
187
-
188
-
189
-
190
-
191
-
192
-
193
-
194
-
195
-
196
-
197
-
198
-
199
-
200
-
201
-
202
-
203
-
204
-
205
-
206
-
207
-
208
-
209
-
210
-
211
-
212
-
213
-
214
-
215
-
216
-
217
-
218
-
219
-
220
-
221
-
222
-
223
-
224
-
225
-
226
-
227
-
228
-
229
-
230
-
231
-
232
-
233
-
234
-
 235
235 -
 236
236 -
 237
237 -
 238
238 -
 239
239 -
 240
240 -
 241
241 -
 242
242 -
 243
243 -
 244
244 -
 245
245 -
246
-
247
-
248
-
249
-
250
-
251
-
252
-
253
-
254
-
255
-
256
-
257
-
258
-
259
-
260
-
261
-
262
-
263
-
264
-
265
-
266
-
267
-
268
-
269
-
270
-
271
-
272
-
273
-
274
-
275
-
276
-
277
-
278
-
279
-
280
-
281
-
282
-
283
-
284
-
285
-
286
-
287
-
288
-
289
-
290
-
291
-
292
-
293
-
294
-
295
-
296
-
297
-
298
-
299
-
300
-
301
-
302
-
303
-
304
-
305
-
306
-
307
-
308
-
309
-
310
-
311
-
312
-
313
-
314
-
315
-
316
-
317
-
318
-
319
-
320
-
321
-
322
-
323
-
324
-
325
-
326
-
327
-
328
-
329
-
330
-
331
-
332
-
333
-
334
-
335
-
336
-
337
-
338
-
339
-
340
-
341
-
342
-
343
-
344
-
345
-
346
-
347
-
348
-
349
-
350
-
351
-
352
-
353
-
354
-
355
-
356
-
357
-
358
-
359
-
360
-
361
-
362
-
363
-
364
-
365
-
366
-
367
-
368
-
369
-
370
-
371
-
372
-
373
-
374
-
375
-
376
-
377
-
378
-
379
-
380
-
381
-
382
-
383
-
384
-
385
-
386
-
387
-
388
-
389
-
390
 |
 |