Dell EqualLogic PS6210XS EqualLogic Group Manager Administrator s Guide PS Ser - Page 319
About Displaying Performance Statistics with the Performance Monitor
 |
View all Dell EqualLogic PS6210XS manuals
Add to My Manuals
Save this manual to your list of manuals |
Page 319 highlights
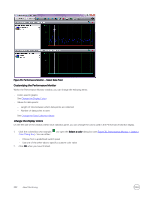
• Replication schedules, replication (including inbound and outbound replication), and replication partners • Alarms and operations (including critical and warning alarms, actions, group operations, and failback operations), and storage pool free space • Group members (including a specific member), the member health status, and member space • Member enclosures, including power supplies and other hardware • Control modules • Disk drives • Network hardware • Volumes, collections, and snapshots, including current and requested status About Displaying Performance Statistics with the Performance Monitor The Group Manager Performance Monitor shows performance statistics for the drives or control modules in a member. The Performance Monitor GUI, accessible from the Group Manager GUI, shows statistical data at regular time intervals. You use icons to start or stop polling the data, and to navigate through the captured data. You can display up to four sets of statistics. The Performance Monitor provides some flexibility, allowing you to change how data is displayed. You can view data as a chart, a histogram (bar chart), or a data table. For example, in chart view, you can click at any place along the graph and show details for a given time slice. You can also change the Performance Monitor display colors used in graphs, change the length of time between which data points are collected, and change the number of data points to save. To more effectively monitor multiple PS Series groups from a single GUI, Dell recommends that you use the SAN Headquarters monitoring tool. Start Performance Monitor from the Tools Menu 1. Open the Tools menu and click Performance monitor. The Group Manager Performance Monitor window opens. 2. Click Add statistics to open the Select Statistics dialog box. 3. Expand Members. 4. Expand a specific member. 5. Expand a component or statistics category. 6. Select a counter set to display. 7. Click OK. In the Performance Monitor window, use the buttons and icons along the top of the window to control which data is displayed and how it is displayed. Start Performance Monitor from the Navigation Pane Tree View 1. Click Group. 2. Expand Members and select a member from the list. 3. Either: • Click the Disks tab to monitor a drive. • Click the Network tab to monitor an Ethernet port. 4. Select the component that you want to monitor. 5. In the Activities panel, click the link for the type of statistics that you want to monitor. In the Performance Monitor window, use the buttons and icons along the top of the window to control which data is displayed and how it is displayed. NOTE: While it is possible to have several Performance Monitor windows open at the same time, Dell recommends running only one instance at a time to avoid possible unexpected results. Performance Monitor Operation Icons Table 54. Performance Monitor Operation Iconss shows the operation icons in the Performance Monitor window. About Monitoring 319
-
 1
1 -
2
-
3
-
4
-
5
-
6
-
7
-
8
-
9
-
10
-
11
-
12
-
13
-
14
-
15
-
16
-
17
-
18
-
19
-
20
-
21
-
22
-
23
-
24
-
25
-
26
-
27
-
28
-
29
-
30
-
31
-
32
-
33
-
34
-
35
-
36
-
37
-
38
-
39
-
40
-
41
-
42
-
43
-
44
-
45
-
46
-
47
-
48
-
49
-
50
-
51
-
52
-
53
-
54
-
55
-
56
-
57
-
58
-
59
-
60
-
61
-
62
-
63
-
64
-
65
-
66
-
67
-
68
-
69
-
70
-
71
-
72
-
73
-
74
-
75
-
76
-
77
-
78
-
79
-
80
-
81
-
82
-
83
-
84
-
85
-
86
-
87
-
88
-
89
-
90
-
91
-
92
-
93
-
94
-
95
-
96
-
97
-
98
-
99
-
100
-
101
-
102
-
103
-
104
-
105
-
106
-
107
-
108
-
109
-
110
-
111
-
112
-
113
-
114
-
115
-
116
-
117
-
118
-
119
-
120
-
121
-
122
-
123
-
124
-
125
-
126
-
127
-
128
-
129
-
130
-
131
-
132
-
133
-
134
-
135
-
136
-
137
-
138
-
139
-
140
-
141
-
142
-
143
-
144
-
145
-
146
-
147
-
148
-
149
-
150
-
151
-
152
-
153
-
154
-
155
-
156
-
157
-
158
-
159
-
160
-
161
-
162
-
163
-
164
-
165
-
166
-
167
-
168
-
169
-
170
-
171
-
172
-
173
-
174
-
175
-
176
-
177
-
178
-
179
-
180
-
181
-
182
-
183
-
184
-
185
-
186
-
187
-
188
-
189
-
190
-
191
-
192
-
193
-
194
-
195
-
196
-
197
-
198
-
199
-
200
-
201
-
202
-
203
-
204
-
205
-
206
-
207
-
208
-
209
-
210
-
211
-
212
-
213
-
214
-
215
-
216
-
217
-
218
-
219
-
220
-
221
-
222
-
223
-
224
-
225
-
226
-
227
-
228
-
229
-
230
-
231
-
232
-
233
-
234
-
235
-
236
-
237
-
238
-
239
-
240
-
241
-
242
-
243
-
244
-
245
-
246
-
247
-
248
-
249
-
250
-
251
-
252
-
253
-
254
-
255
-
256
-
257
-
258
-
259
-
260
-
261
-
262
-
263
-
264
-
265
-
266
-
267
-
268
-
269
-
270
-
271
-
272
-
273
-
274
-
275
-
276
-
277
-
278
-
279
-
280
-
281
-
282
-
283
-
284
-
285
-
286
-
287
-
288
-
289
-
290
-
291
-
292
-
293
-
294
-
295
-
296
-
297
-
298
-
299
-
300
-
301
-
302
-
303
-
304
-
305
-
306
-
307
-
308
-
309
-
310
-
311
-
312
-
313
-
 314
314 -
 315
315 -
 316
316 -
 317
317 -
 318
318 -
 319
319 -
 320
320 -
 321
321 -
 322
322 -
 323
323 -
 324
324 -
325
-
326
-
327
-
328
-
329
-
330
-
331
-
332
-
333
-
334
-
335
-
336
-
337
-
338
-
339
-
340
-
341
-
342
-
343
-
344
-
345
-
346
-
347
-
348
-
349
-
350
-
351
-
352
-
353
-
354
-
355
 |
 |
