Dell EqualLogic PS6210XS EqualLogic Group Manager Administrator s Guide PS Ser - Page 324
About SAN Headquarters, Manage SAN Headquarters Action Alarm
 |
View all Dell EqualLogic PS6210XS manuals
Add to My Manuals
Save this manual to your list of manuals |
Page 324 highlights
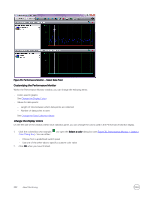
About SAN Headquarters SAN Headquarters (SAN HQ) is a performance-monitoring tool that enables you to monitor multiple PS Series groups from a single graphical user interface (GUI). SAN HQ gathers and formats configuration and performance data into easy-to-view charts and graphs. Analyzing this data can help you improve performance and more effectively allocate group resources. SAN HQ allows to you deploy Dell SupportAssist for diagnostic data collection on a weekly basis, on-demand as needed, or when critical events occur. Diagnostic data collections are automatically uploaded to Dell Technical Support for analysis, unless you disable automatic uploads. In that case, the data is encrypted and stored locally. By default, Group Manager displays an Action alarm in the Alarms and Operations panel in the lower part of the window whenever SAN HQ is not monitoring the group. Using SAN HQ, you can: • Quickly be informed of problems related to hardware, capacity, and performance • Improve performance by identifying performance bottlenecks • Obtain comprehensive information about group performance based on latency, IOPS, I/O rate, I/O size, and other data. Using 95th percentile reporting, remove the top 5 percent of spikes in data for a more accurate picture of your storage performance. • View real-time data for group member or volume I/O and save the results for future analysis • From a single SAN HQ client, monitor group performance data from multiple servers • Determine how the group is performing, relative to a typical I/O workload of small, random I/O operations. This information can help you determine if a group has reached its full capabilities, or whether you can increase the group workload with no impact on performance. • Display performance-based load-balancing data for the group (the default), for all pools on the group, or for all members in the group. • For a selected group, pool, or member, apply different RAID policies and analyze the performance benefits • View events, audits, and group alerts • More effectively allocate group resources by identifying underutilized resources • Enable multiple individuals to access and monitor the same performance data • Preserve group performance data for later analysis by creating archives • Create customized reports of group performance data • Export group performance data to a spreadsheet • Specify favorite views • Visualize synchronous replication volumes and NAS containers • Display space consumed by recoverable volumes in the recovery bin • Display space available for snapshot borrowing • See the number of Ethernet ports with active and inactive data center bridging (DCB), and the number of ports incompatible with DCB For complete information about installing and using SAN Headquarters, see the Dell EqualLogic SAN Headquarters Installation and User's Guide. Manage SAN Headquarters Action Alarm In Group Manager, the SAN Headquarters (SAN HQ) section of the Group Configuration General panel lists servers from which SAN HQ is currently monitoring or had previously monitored the group. By default, if no SAN HQ server is currently monitoring the group, the Alarms and Operations panel at the bottom of the Group Manager GUI displays an Action alarm. To hide the alarm and configure Group Manager to never display a SAN HQ monitoring alarm in the future: 324 About Monitoring
-
 1
1 -
2
-
3
-
4
-
5
-
6
-
7
-
8
-
9
-
10
-
11
-
12
-
13
-
14
-
15
-
16
-
17
-
18
-
19
-
20
-
21
-
22
-
23
-
24
-
25
-
26
-
27
-
28
-
29
-
30
-
31
-
32
-
33
-
34
-
35
-
36
-
37
-
38
-
39
-
40
-
41
-
42
-
43
-
44
-
45
-
46
-
47
-
48
-
49
-
50
-
51
-
52
-
53
-
54
-
55
-
56
-
57
-
58
-
59
-
60
-
61
-
62
-
63
-
64
-
65
-
66
-
67
-
68
-
69
-
70
-
71
-
72
-
73
-
74
-
75
-
76
-
77
-
78
-
79
-
80
-
81
-
82
-
83
-
84
-
85
-
86
-
87
-
88
-
89
-
90
-
91
-
92
-
93
-
94
-
95
-
96
-
97
-
98
-
99
-
100
-
101
-
102
-
103
-
104
-
105
-
106
-
107
-
108
-
109
-
110
-
111
-
112
-
113
-
114
-
115
-
116
-
117
-
118
-
119
-
120
-
121
-
122
-
123
-
124
-
125
-
126
-
127
-
128
-
129
-
130
-
131
-
132
-
133
-
134
-
135
-
136
-
137
-
138
-
139
-
140
-
141
-
142
-
143
-
144
-
145
-
146
-
147
-
148
-
149
-
150
-
151
-
152
-
153
-
154
-
155
-
156
-
157
-
158
-
159
-
160
-
161
-
162
-
163
-
164
-
165
-
166
-
167
-
168
-
169
-
170
-
171
-
172
-
173
-
174
-
175
-
176
-
177
-
178
-
179
-
180
-
181
-
182
-
183
-
184
-
185
-
186
-
187
-
188
-
189
-
190
-
191
-
192
-
193
-
194
-
195
-
196
-
197
-
198
-
199
-
200
-
201
-
202
-
203
-
204
-
205
-
206
-
207
-
208
-
209
-
210
-
211
-
212
-
213
-
214
-
215
-
216
-
217
-
218
-
219
-
220
-
221
-
222
-
223
-
224
-
225
-
226
-
227
-
228
-
229
-
230
-
231
-
232
-
233
-
234
-
235
-
236
-
237
-
238
-
239
-
240
-
241
-
242
-
243
-
244
-
245
-
246
-
247
-
248
-
249
-
250
-
251
-
252
-
253
-
254
-
255
-
256
-
257
-
258
-
259
-
260
-
261
-
262
-
263
-
264
-
265
-
266
-
267
-
268
-
269
-
270
-
271
-
272
-
273
-
274
-
275
-
276
-
277
-
278
-
279
-
280
-
281
-
282
-
283
-
284
-
285
-
286
-
287
-
288
-
289
-
290
-
291
-
292
-
293
-
294
-
295
-
296
-
297
-
298
-
299
-
300
-
301
-
302
-
303
-
304
-
305
-
306
-
307
-
308
-
309
-
310
-
311
-
312
-
313
-
314
-
315
-
316
-
317
-
318
-
 319
319 -
 320
320 -
 321
321 -
 322
322 -
 323
323 -
 324
324 -
 325
325 -
 326
326 -
 327
327 -
 328
328 -
 329
329 -
330
-
331
-
332
-
333
-
334
-
335
-
336
-
337
-
338
-
339
-
340
-
341
-
342
-
343
-
344
-
345
-
346
-
347
-
348
-
349
-
350
-
351
-
352
-
353
-
354
-
355
 |
 |