Cisco MDS-9124 Troubleshooting Guide - Page 539

Using Fibre Channel SPAN

Page 539 highlights

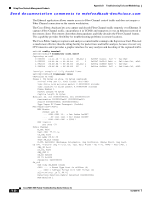
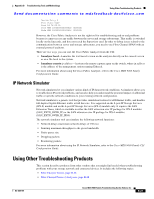
Appendix B Troubleshooting Tools and Methodology Using Cisco MDS 9000 Family Tools Send documentation comments to [email protected] The no logging console command shown in Example B-7: • Disables console logging • Enabled by default Example B-7 no logging console Command switch(config)# no logging console The terminal monitor command shown in Example B-8: • Enables logging for telnet or SSH • Disabled by default Example B-8 terminal monitor Command switch# terminal monitor Using Fibre Channel SPAN You can use the Switched Port Analyzer (SPAN) utility to perform detailed troubleshooting or to take a sample of traffic from a particular application host for proactive monitoring and analysis. This utility is most helpful when you have a Fibre Channel protocol analyzer available and you are monitoring user traffic between two FC IDs. When you have a problem in your storage network that you cannot solve by fixing the device configuration, you typically need to take a look at the protocol level. You can use debug commands to look at the control traffic between an end node and a switch. However, when you need to focus on all the traffic originating from or destined to a particular end node such as a host or a disk, you can use a protocol analyzer to capture protocol traces. To use a protocol analyzer, you must insert the analyzer in-line with the device under analysis, which disrupts input and output (I/O) to and from the device. This problem is worse when the point of analysis is on an Inter-Switch Link (ISL) link between two switches. In this case, the disruption may be significant depending on what devices are downstream from the severed ISL link. In Ethernet networks, this problem can be solved using the SPAN utility, which is provided with the Cisco Catalyst Family of Ethernet switches. SPAN has also been implemented with the Cisco MDS 9000 Family switches for use in Fibre Channel networks. SPAN lets you take a copy of all traffic and direct it to another port within the switch. The process is non-disruptive to any connected devices and is facilitated in hardware, which prevents any unnecessary CPU load. Using Fibre Channel SPAN, you can connect a Fibre Channel analyzer, such as a Finisar analyzer, to an unused port on the switch and then SPAN a copy of the traffic from a port under analysis to the analyzer in a non-disruptive fashion. SPAN allows you to create up to 16 independent SPAN sessions within the switch. Each session can have up to four unique sources and one destination port. In addition, you can apply a filter to capture only the traffic received or the traffic transmitted. With Fibre Channel SPAN, you can even capture traffic from a particular Virtual SAN (VSAN). To start the SPAN utility use the CLI command span session session_num, where session_num identifies a specific SPAN session. When you enter this command, the system displays a submenu, which lets you configure the destination interface and the source VSAN or interfaces. switch2# config terminal switch2(config)# span session 1

  • 1
  • 2
  • 3
  • 4
  • 5
  • 6
  • 7
  • 8
  • 9
  • 10
  • 11
  • 12
  • 13
  • 14
  • 15
  • 16
  • 17
  • 18
  • 19
  • 20
  • 21
  • 22
  • 23
  • 24
  • 25
  • 26
  • 27
  • 28
  • 29
  • 30
  • 31
  • 32
  • 33
  • 34
  • 35
  • 36
  • 37
  • 38
  • 39
  • 40
  • 41
  • 42
  • 43
  • 44
  • 45
  • 46
  • 47
  • 48
  • 49
  • 50
  • 51
  • 52
  • 53
  • 54
  • 55
  • 56
  • 57
  • 58
  • 59
  • 60
  • 61
  • 62
  • 63
  • 64
  • 65
  • 66
  • 67
  • 68
  • 69
  • 70
  • 71
  • 72
  • 73
  • 74
  • 75
  • 76
  • 77
  • 78
  • 79
  • 80
  • 81
  • 82
  • 83
  • 84
  • 85
  • 86
  • 87
  • 88
  • 89
  • 90
  • 91
  • 92
  • 93
  • 94
  • 95
  • 96
  • 97
  • 98
  • 99
  • 100
  • 101
  • 102
  • 103
  • 104
  • 105
  • 106
  • 107
  • 108
  • 109
  • 110
  • 111
  • 112
  • 113
  • 114
  • 115
  • 116
  • 117
  • 118
  • 119
  • 120
  • 121
  • 122
  • 123
  • 124
  • 125
  • 126
  • 127
  • 128
  • 129
  • 130
  • 131
  • 132
  • 133
  • 134
  • 135
  • 136
  • 137
  • 138
  • 139
  • 140
  • 141
  • 142
  • 143
  • 144
  • 145
  • 146
  • 147
  • 148
  • 149
  • 150
  • 151
  • 152
  • 153
  • 154
  • 155
  • 156
  • 157
  • 158
  • 159
  • 160
  • 161
  • 162
  • 163
  • 164
  • 165
  • 166
  • 167
  • 168
  • 169
  • 170
  • 171
  • 172
  • 173
  • 174
  • 175
  • 176
  • 177
  • 178
  • 179
  • 180
  • 181
  • 182
  • 183
  • 184
  • 185
  • 186
  • 187
  • 188
  • 189
  • 190
  • 191
  • 192
  • 193
  • 194
  • 195
  • 196
  • 197
  • 198
  • 199
  • 200
  • 201
  • 202
  • 203
  • 204
  • 205
  • 206
  • 207
  • 208
  • 209
  • 210
  • 211
  • 212
  • 213
  • 214
  • 215
  • 216
  • 217
  • 218
  • 219
  • 220
  • 221
  • 222
  • 223
  • 224
  • 225
  • 226
  • 227
  • 228
  • 229
  • 230
  • 231
  • 232
  • 233
  • 234
  • 235
  • 236
  • 237
  • 238
  • 239
  • 240
  • 241
  • 242
  • 243
  • 244
  • 245
  • 246
  • 247
  • 248
  • 249
  • 250
  • 251
  • 252
  • 253
  • 254
  • 255
  • 256
  • 257
  • 258
  • 259
  • 260
  • 261
  • 262
  • 263
  • 264
  • 265
  • 266
  • 267
  • 268
  • 269
  • 270
  • 271
  • 272
  • 273
  • 274
  • 275
  • 276
  • 277
  • 278
  • 279
  • 280
  • 281
  • 282
  • 283
  • 284
  • 285
  • 286
  • 287
  • 288
  • 289
  • 290
  • 291
  • 292
  • 293
  • 294
  • 295
  • 296
  • 297
  • 298
  • 299
  • 300
  • 301
  • 302
  • 303
  • 304
  • 305
  • 306
  • 307
  • 308
  • 309
  • 310
  • 311
  • 312
  • 313
  • 314
  • 315
  • 316
  • 317
  • 318
  • 319
  • 320
  • 321
  • 322
  • 323
  • 324
  • 325
  • 326
  • 327
  • 328
  • 329
  • 330
  • 331
  • 332
  • 333
  • 334
  • 335
  • 336
  • 337
  • 338
  • 339
  • 340
  • 341
  • 342
  • 343
  • 344
  • 345
  • 346
  • 347
  • 348
  • 349
  • 350
  • 351
  • 352
  • 353
  • 354
  • 355
  • 356
  • 357
  • 358
  • 359
  • 360
  • 361
  • 362
  • 363
  • 364
  • 365
  • 366
  • 367
  • 368
  • 369
  • 370
  • 371
  • 372
  • 373
  • 374
  • 375
  • 376
  • 377
  • 378
  • 379
  • 380
  • 381
  • 382
  • 383
  • 384
  • 385
  • 386
  • 387
  • 388
  • 389
  • 390
  • 391
  • 392
  • 393
  • 394
  • 395
  • 396
  • 397
  • 398
  • 399
  • 400
  • 401
  • 402
  • 403
  • 404
  • 405
  • 406
  • 407
  • 408
  • 409
  • 410
  • 411
  • 412
  • 413
  • 414
  • 415
  • 416
  • 417
  • 418
  • 419
  • 420
  • 421
  • 422
  • 423
  • 424
  • 425
  • 426
  • 427
  • 428
  • 429
  • 430
  • 431
  • 432
  • 433
  • 434
  • 435
  • 436
  • 437
  • 438
  • 439
  • 440
  • 441
  • 442
  • 443
  • 444
  • 445
  • 446
  • 447
  • 448
  • 449
  • 450
  • 451
  • 452
  • 453
  • 454
  • 455
  • 456
  • 457
  • 458
  • 459
  • 460
  • 461
  • 462
  • 463
  • 464
  • 465
  • 466
  • 467
  • 468
  • 469
  • 470
  • 471
  • 472
  • 473
  • 474
  • 475
  • 476
  • 477
  • 478
  • 479
  • 480
  • 481
  • 482
  • 483
  • 484
  • 485
  • 486
  • 487
  • 488
  • 489
  • 490
  • 491
  • 492
  • 493
  • 494
  • 495
  • 496
  • 497
  • 498
  • 499
  • 500
  • 501
  • 502
  • 503
  • 504
  • 505
  • 506
  • 507
  • 508
  • 509
  • 510
  • 511
  • 512
  • 513
  • 514
  • 515
  • 516
  • 517
  • 518
  • 519
  • 520
  • 521
  • 522
  • 523
  • 524
  • 525
  • 526
  • 527
  • 528
  • 529
  • 530
  • 531
  • 532
  • 533
  • 534
  • 535
  • 536
  • 537
  • 538
  • 539
  • 540
  • 541
  • 542
  • 543
  • 544
  • 545
  • 546
  • 547
  • 548
  • 549
  • 550
  • 551
  • 552
  • 553
  • 554
  • 555
  • 556
  • 557
  • 558
  • 559
  • 560

Send documentation comments to [email protected]
B-23
Cisco MDS 9000 Family Troubleshooting Guide, Release 3.x
OL-9285-05
Appendix B
Troubleshooting Tools and Methodology
Using Cisco MDS 9000 Family Tools
The
no logging console
command shown in
Example B-7
:
Disables console logging
Enabled by default
Example B-7
no logging console Command
switch(config)# no logging console
The
terminal monitor
command shown in
Example B-8
:
Enables logging for telnet or SSH
Disabled by default
Example B-8
terminal monitor Command
switch# terminal monitor
Using Fibre Channel SPAN
You can use the Switched Port Analyzer (SPAN) utility to perform detailed troubleshooting or to take a
sample of traffic from a particular application host for proactive monitoring and analysis. This utility is
most helpful when you have a Fibre Channel protocol analyzer available and you are monitoring user
traffic between two FC IDs.
When you have a problem in your storage network that you cannot solve by fixing the device
configuration, you typically need to take a look at the protocol level. You can use debug commands to
look at the control traffic between an end node and a switch. However, when you need to focus on all the
traffic originating from or destined to a particular end node such as a host or a disk, you can use a
protocol analyzer to capture protocol traces.
To use a protocol analyzer, you must insert the analyzer in-line with the device under analysis, which
disrupts input and output (I/O) to and from the device. This problem is worse when the point of analysis
is on an Inter-Switch Link (ISL) link between two switches. In this case, the disruption may be
significant depending on what devices are downstream from the severed ISL link.
In Ethernet networks, this problem can be solved using the SPAN utility, which is provided with the
Cisco Catalyst Family of Ethernet switches. SPAN has also been implemented with the Cisco MDS 9000
Family switches for use in Fibre Channel networks. SPAN lets you take a
copy
of all traffic and direct it
to another port within the switch. The process is non-disruptive to any connected devices and is
facilitated in hardware, which prevents any unnecessary CPU load. Using Fibre Channel SPAN, you can
connect a Fibre Channel analyzer, such as a Finisar analyzer, to an unused port on the switch and then
SPAN a copy of the traffic from a port under analysis to the analyzer in a non-disruptive fashion.
SPAN allows you to create up to 16 independent
SPAN
sessions within the switch. Each session can have
up to four unique sources and one destination port. In addition, you can apply a filter to capture only the
traffic received or the traffic transmitted. With Fibre Channel SPAN, you can even capture
traffic from
a particular Virtual SAN (VSAN).
To start the SPAN utility use the CLI command
span session
session_num
, where
session_num
identifies a specific SPAN session. When you enter this command, the system displays a submenu, which
lets you configure the destination interface and the source VSAN or interfaces.
switch2#
config terminal
switch2(config)#
span session 1
<<=== Create a span session
switch2(config-span)#
source interface fc1/8
<<=== Specify the port to be spanned