Netgear GS752TS GS7xxTS-TPS Software Admin Manual - Page 60
The also provides the information shown in the following table
 |
View all Netgear GS752TS manuals
Add to My Manuals
Save this manual to your list of manuals |
Page 60 highlights
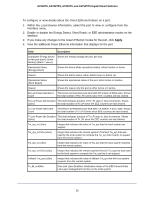
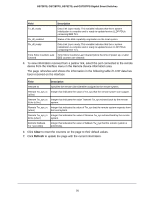
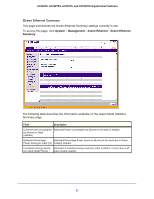
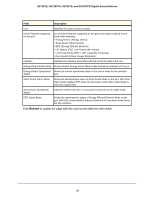
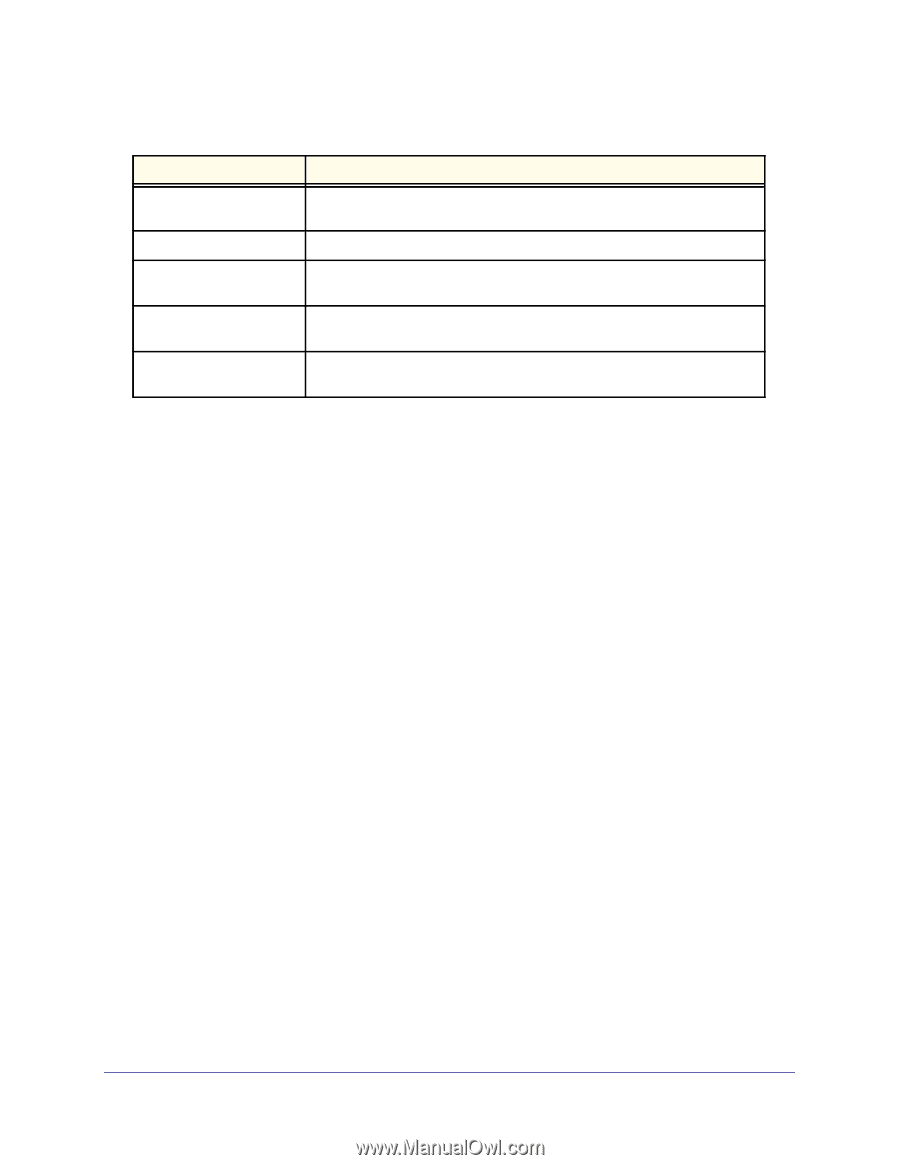
GS728TS, GS728TPS, GS752TS, and GS752TPS Gigabit Smart Switches The page also provides the information shown in the following table: Field Description Percentage LPI time per Stack Time spent in LPI mode since EEE counters are last cleared. Sample No Sample index. Time Since The Sample Was Recorded Each time the page is refreshed it shows a different time as it reflects the difference in current time and time at which the sample was recorded. Percentage Time spent in Percentage of time spent in LPI mode during the current measurement LPI mode since last sample interval. Percentage Time spent in Percentage of time spent in LPI mode since EEE LPI statistics were last LPI mode since last reset reset. 60
-
 1
1 -
2
-
3
-
4
-
5
-
6
-
7
-
8
-
9
-
10
-
11
-
12
-
13
-
14
-
15
-
16
-
17
-
18
-
19
-
20
-
21
-
22
-
23
-
24
-
25
-
26
-
27
-
28
-
29
-
30
-
31
-
32
-
33
-
34
-
35
-
36
-
37
-
38
-
39
-
40
-
41
-
42
-
43
-
44
-
45
-
46
-
47
-
48
-
49
-
50
-
51
-
52
-
53
-
54
-
 55
55 -
 56
56 -
 57
57 -
 58
58 -
 59
59 -
 60
60 -
 61
61 -
 62
62 -
 63
63 -
 64
64 -
 65
65 -
66
-
67
-
68
-
69
-
70
-
71
-
72
-
73
-
74
-
75
-
76
-
77
-
78
-
79
-
80
-
81
-
82
-
83
-
84
-
85
-
86
-
87
-
88
-
89
-
90
-
91
-
92
-
93
-
94
-
95
-
96
-
97
-
98
-
99
-
100
-
101
-
102
-
103
-
104
-
105
-
106
-
107
-
108
-
109
-
110
-
111
-
112
-
113
-
114
-
115
-
116
-
117
-
118
-
119
-
120
-
121
-
122
-
123
-
124
-
125
-
126
-
127
-
128
-
129
-
130
-
131
-
132
-
133
-
134
-
135
-
136
-
137
-
138
-
139
-
140
-
141
-
142
-
143
-
144
-
145
-
146
-
147
-
148
-
149
-
150
-
151
-
152
-
153
-
154
-
155
-
156
-
157
-
158
-
159
-
160
-
161
-
162
-
163
-
164
-
165
-
166
-
167
-
168
-
169
-
170
-
171
-
172
-
173
-
174
-
175
-
176
-
177
-
178
-
179
-
180
-
181
-
182
-
183
-
184
-
185
-
186
-
187
-
188
-
189
-
190
-
191
-
192
-
193
-
194
-
195
-
196
-
197
-
198
-
199
-
200
-
201
-
202
-
203
-
204
-
205
-
206
-
207
-
208
-
209
-
210
-
211
-
212
-
213
-
214
-
215
-
216
-
217
-
218
-
219
-
220
-
221
-
222
-
223
-
224
-
225
-
226
-
227
-
228
-
229
-
230
-
231
-
232
-
233
-
234
-
235
-
236
-
237
-
238
-
239
-
240
-
241
-
242
-
243
-
244
-
245
-
246
-
247
-
248
-
249
-
250
-
251
-
252
-
253
-
254
-
255
-
256
-
257
-
258
-
259
-
260
-
261
-
262
-
263
-
264
-
265
-
266
-
267
-
268
-
269
-
270
-
271
-
272
-
273
-
274
-
275
-
276
-
277
-
278
-
279
-
280
-
281
-
282
-
283
-
284
-
285
-
286
-
287
-
288
-
289
-
290
-
291
-
292
-
293
-
294
-
295
-
296
-
297
-
298
-
299
-
300
-
301
-
302
-
303
-
304
-
305
-
306
-
307
-
308
-
309
-
310
-
311
-
312
-
313
-
314
-
315
-
316
-
317
-
318
-
319
-
320
-
321
-
322
-
323
-
324
-
325
-
326
-
327
-
328
-
329
 |
 |
60
GS728TS, GS728TPS, GS752TS, and GS752TPS Gigabit Smart Switches
The page also provides the information shown in the following table:
Field
Description
Percentage LPI time per
Stack
Time spent in LPI mode since EEE counters are last cleared.
Sample No
Sample index.
Time Since The Sample
Was Recorded
Each time the page is refreshed it shows a different time as it reflects the
difference in current time and time at which the sample was recorded.
Percentage Time spent in
LPI mode since last sample
Percentage of time spent in LPI mode during the current measurement
interval.
Percentage Time spent in
LPI mode since last reset
Percentage of time spent in LPI mode since EEE LPI statistics were last
reset.