HP StorageWorks 8/80 HP StorageWorks Fabric OS 6.1.x administrator guide (5697 - Page 338
Top Talker monitors
 |
View all HP StorageWorks 8/80 manuals
Add to My Manuals
Save this manual to your list of manuals |
Page 338 highlights
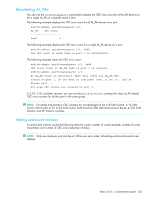
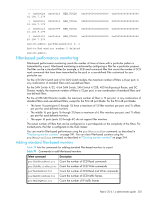
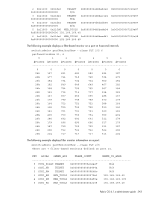
ISL monitors are deleted when Top Talker is installed and are restored when Top Talker is deleted. (See "Top Talker monitors" for information about Top Talker monitors.) You can monitor ISL performance using the perfMonitorShow command, as described in ""Displaying monitor counters"." You can clear ISL counters using the perfMonitorClear command, as described in "Clearing monitor counters" on page 344. ISL monitoring is not supported on the DC Director. Top Talker monitors Top Talker monitors determine the flows (SID/DID pairs) that are the major users of bandwidth (after initial stabilization). Top Talker monitors measure bandwidth usage data in real-time and relative to the port on which the monitor is installed. NOTE: Initial stabilization is the time taken by a flow to reach the maximum bandwidth. This time varies depending on the number of flows in the fabric and other factors. The incubation period can be up to 14 seconds in the DC Director and up to 82 seconds in the SAN Switch 4/32, 4/64 SAN Switch, SAN Switch 4/32B, 400 Multi-protocol Router, and 4/256 SAN Director. Top Talker can be installed only on switches that run Fabric OS 6.0.0 or later. Top Talker monitors are not supported on the 4/8 SAN Switch, 4/16 SAN Switch. Applications can use the Top Talker data to do the following: • Re-route the traffic through different ports that are less busy, so as not to overload a given port. • Alert you of the top-talking flows on a port if the total traffic on the port exceeds the acceptable bandwidth consumption. You can use Top Talkers to identify the SID/DID pairs that consume the most bandwidth and can then configure them with certain Quality of Service (QoS) attributes so they get proper priority. See "Adaptive networking" on page 331 for information on QoS. The Top Talker monitor is based on SID/DID and not WWNs. Once Top Talker is installed on a port, it remains installed across power cycles. Top Talker supports two modes: port mode and fabric mode. • Port mode Top Talker A Top Talker monitor can be installed on an F_Port to measure the traffic originating from the F_Port and flowing to different destinations. • Fabric mode Top Talker In fabric mode, Top Talker monitors are installed on all E_Ports in the fabric and measure the data rate of all the possible flows in the fabric (ingress E_Port traffic only). In fabric mode, Top Talker monitors can determine the top n bandwidth users on a given switch. You can install Top Talker monitors either in port mode or fabric mode, but not both. How do Top Talker monitors differ from end-to-end monitors? End-to-end monitors provide counter statistics for traffic flowing between a given SID-DID pair. Top Talker monitors identify all possible SID-DID flow combinations that are possible on a given port and provides a sorted output of the top talking flows. Also, if the number of flows exceeds the hardware resources, existing end-to-end monitors fail to get real time data for all of them; however, Top Talker monitors can monitor all flows for a given port (E_Port or F_Port). Admin Domain considerations: Top Talker monitors are always installed in AD255. NPIV considerations: Top Talker takes NPIV devices into consideration when calculating the top talking flows. Adding a Top Talker monitor on an F_Port Use the perfttmon command to add, delete, and display Top Talker monitors. Refer to the Fabric OS Command Reference for details about the perfttmon command. 338 Administering Advanced Performance Monitoring
-
 1
1 -
2
-
3
-
4
-
5
-
6
-
7
-
8
-
9
-
10
-
11
-
12
-
13
-
14
-
15
-
16
-
17
-
18
-
19
-
20
-
21
-
22
-
23
-
24
-
25
-
26
-
27
-
28
-
29
-
30
-
31
-
32
-
33
-
34
-
35
-
36
-
37
-
38
-
39
-
40
-
41
-
42
-
43
-
44
-
45
-
46
-
47
-
48
-
49
-
50
-
51
-
52
-
53
-
54
-
55
-
56
-
57
-
58
-
59
-
60
-
61
-
62
-
63
-
64
-
65
-
66
-
67
-
68
-
69
-
70
-
71
-
72
-
73
-
74
-
75
-
76
-
77
-
78
-
79
-
80
-
81
-
82
-
83
-
84
-
85
-
86
-
87
-
88
-
89
-
90
-
91
-
92
-
93
-
94
-
95
-
96
-
97
-
98
-
99
-
100
-
101
-
102
-
103
-
104
-
105
-
106
-
107
-
108
-
109
-
110
-
111
-
112
-
113
-
114
-
115
-
116
-
117
-
118
-
119
-
120
-
121
-
122
-
123
-
124
-
125
-
126
-
127
-
128
-
129
-
130
-
131
-
132
-
133
-
134
-
135
-
136
-
137
-
138
-
139
-
140
-
141
-
142
-
143
-
144
-
145
-
146
-
147
-
148
-
149
-
150
-
151
-
152
-
153
-
154
-
155
-
156
-
157
-
158
-
159
-
160
-
161
-
162
-
163
-
164
-
165
-
166
-
167
-
168
-
169
-
170
-
171
-
172
-
173
-
174
-
175
-
176
-
177
-
178
-
179
-
180
-
181
-
182
-
183
-
184
-
185
-
186
-
187
-
188
-
189
-
190
-
191
-
192
-
193
-
194
-
195
-
196
-
197
-
198
-
199
-
200
-
201
-
202
-
203
-
204
-
205
-
206
-
207
-
208
-
209
-
210
-
211
-
212
-
213
-
214
-
215
-
216
-
217
-
218
-
219
-
220
-
221
-
222
-
223
-
224
-
225
-
226
-
227
-
228
-
229
-
230
-
231
-
232
-
233
-
234
-
235
-
236
-
237
-
238
-
239
-
240
-
241
-
242
-
243
-
244
-
245
-
246
-
247
-
248
-
249
-
250
-
251
-
252
-
253
-
254
-
255
-
256
-
257
-
258
-
259
-
260
-
261
-
262
-
263
-
264
-
265
-
266
-
267
-
268
-
269
-
270
-
271
-
272
-
273
-
274
-
275
-
276
-
277
-
278
-
279
-
280
-
281
-
282
-
283
-
284
-
285
-
286
-
287
-
288
-
289
-
290
-
291
-
292
-
293
-
294
-
295
-
296
-
297
-
298
-
299
-
300
-
301
-
302
-
303
-
304
-
305
-
306
-
307
-
308
-
309
-
310
-
311
-
312
-
313
-
314
-
315
-
316
-
317
-
318
-
319
-
320
-
321
-
322
-
323
-
324
-
325
-
326
-
327
-
328
-
329
-
330
-
331
-
332
-
 333
333 -
 334
334 -
 335
335 -
 336
336 -
 337
337 -
 338
338 -
 339
339 -
 340
340 -
 341
341 -
 342
342 -
 343
343 -
344
-
345
-
346
-
347
-
348
-
349
-
350
-
351
-
352
-
353
-
354
-
355
-
356
-
357
-
358
-
359
-
360
-
361
-
362
-
363
-
364
-
365
-
366
-
367
-
368
-
369
-
370
-
371
-
372
-
373
-
374
-
375
-
376
-
377
-
378
-
379
-
380
-
381
-
382
-
383
-
384
-
385
-
386
-
387
-
388
-
389
-
390
-
391
-
392
-
393
-
394
-
395
-
396
-
397
-
398
-
399
-
400
-
401
-
402
-
403
-
404
-
405
-
406
-
407
-
408
-
409
-
410
-
411
-
412
-
413
-
414
-
415
-
416
-
417
-
418
-
419
-
420
-
421
-
422
-
423
-
424
-
425
-
426
-
427
-
428
-
429
-
430
-
431
-
432
-
433
-
434
-
435
-
436
-
437
-
438
-
439
-
440
-
441
-
442
-
443
-
444
-
445
-
446
-
447
-
448
-
449
-
450
-
451
-
452
-
453
-
454
-
455
-
456
-
457
-
458
-
459
-
460
-
461
-
462
-
463
-
464
-
465
-
466
-
467
-
468
-
469
-
470
-
471
-
472
-
473
-
474
-
475
-
476
-
477
-
478
-
479
-
480
-
481
-
482
-
483
-
484
-
485
-
486
-
487
-
488
-
489
-
490
-
491
-
492
 |
 |