HP StorageWorks 8/80 HP StorageWorks Fabric OS 6.1.x administrator guide (5697 - Page 340
Using Top Talker monitors in fabric mode
 |
View all HP StorageWorks 8/80 manuals
Add to My Manuals
Save this manual to your list of manuals |
Page 340 highlights
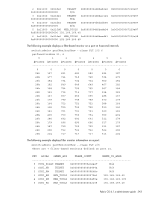
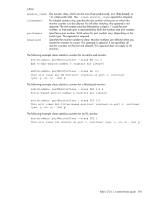
perfttmon --show 7 5 To display the top flows on slot 2, port 4 on the 4/256 SAN Director or DC Director in PID format: perfttmon --show 2/4 pid switch:admin> perfttmon --show 2/4 pid Src_PID Dst_PID MB/sec 0xa90800 0xa05200 6.926 0xa90800 0xa908ef 6.872 Using Top Talker monitors in fabric mode When fabric mode is enabled, you can no longer install Top Talker monitors on an F_Port unless you delete fabric mode. Use the perfttmon command to add, delete, and display Top Talker monitors. Refer to the Fabric OS Command Reference for details about the perfttmon command. Adding Top Talker monitors on all switches in the fabric To add Top Talker monitors on all switches in the fabric: 1. Connect to the switch and log in as admin. 2. Enter the perfttmon --add fabricmode command. perfttmon --add fabricmode Top Talker monitors are added to all E_Ports in the fabric and fabric mode is enabled. Any Top Talker monitors that were already installed on F_Ports are automatically uninstalled. If a new switch joins the fabric, you must run the perfttmon --add fabricmode command on the new switch. The Top Talker configuration information is not automatically propagated to the new switch. Deleting the fabric mode Top Talker monitors To delete the fabric mode Top Talker monitors: 1. Connect to the switch and log in as admin. 2. Enter the perfttmon --delete fabricmode command. perfttmon --delete fabricmode All Top Talker monitors are deleted. Displaying top talking flows on the switch for a given Domain ID To display top talking flows on the switch for a given Domain ID: 1. Connect to the switch and log in as admin. 2. Enter the perfttmon --show dom command. perfttmon --show dom domainid [n] [wwn | pid] where: domainid n wwn | pid The Domain ID of the switch. The number of top talking flows to display, between 1 and 32. The format of the output. The default is wwn. Fabric mode must be enabled for this option. 340 Administering Advanced Performance Monitoring
-
 1
1 -
2
-
3
-
4
-
5
-
6
-
7
-
8
-
9
-
10
-
11
-
12
-
13
-
14
-
15
-
16
-
17
-
18
-
19
-
20
-
21
-
22
-
23
-
24
-
25
-
26
-
27
-
28
-
29
-
30
-
31
-
32
-
33
-
34
-
35
-
36
-
37
-
38
-
39
-
40
-
41
-
42
-
43
-
44
-
45
-
46
-
47
-
48
-
49
-
50
-
51
-
52
-
53
-
54
-
55
-
56
-
57
-
58
-
59
-
60
-
61
-
62
-
63
-
64
-
65
-
66
-
67
-
68
-
69
-
70
-
71
-
72
-
73
-
74
-
75
-
76
-
77
-
78
-
79
-
80
-
81
-
82
-
83
-
84
-
85
-
86
-
87
-
88
-
89
-
90
-
91
-
92
-
93
-
94
-
95
-
96
-
97
-
98
-
99
-
100
-
101
-
102
-
103
-
104
-
105
-
106
-
107
-
108
-
109
-
110
-
111
-
112
-
113
-
114
-
115
-
116
-
117
-
118
-
119
-
120
-
121
-
122
-
123
-
124
-
125
-
126
-
127
-
128
-
129
-
130
-
131
-
132
-
133
-
134
-
135
-
136
-
137
-
138
-
139
-
140
-
141
-
142
-
143
-
144
-
145
-
146
-
147
-
148
-
149
-
150
-
151
-
152
-
153
-
154
-
155
-
156
-
157
-
158
-
159
-
160
-
161
-
162
-
163
-
164
-
165
-
166
-
167
-
168
-
169
-
170
-
171
-
172
-
173
-
174
-
175
-
176
-
177
-
178
-
179
-
180
-
181
-
182
-
183
-
184
-
185
-
186
-
187
-
188
-
189
-
190
-
191
-
192
-
193
-
194
-
195
-
196
-
197
-
198
-
199
-
200
-
201
-
202
-
203
-
204
-
205
-
206
-
207
-
208
-
209
-
210
-
211
-
212
-
213
-
214
-
215
-
216
-
217
-
218
-
219
-
220
-
221
-
222
-
223
-
224
-
225
-
226
-
227
-
228
-
229
-
230
-
231
-
232
-
233
-
234
-
235
-
236
-
237
-
238
-
239
-
240
-
241
-
242
-
243
-
244
-
245
-
246
-
247
-
248
-
249
-
250
-
251
-
252
-
253
-
254
-
255
-
256
-
257
-
258
-
259
-
260
-
261
-
262
-
263
-
264
-
265
-
266
-
267
-
268
-
269
-
270
-
271
-
272
-
273
-
274
-
275
-
276
-
277
-
278
-
279
-
280
-
281
-
282
-
283
-
284
-
285
-
286
-
287
-
288
-
289
-
290
-
291
-
292
-
293
-
294
-
295
-
296
-
297
-
298
-
299
-
300
-
301
-
302
-
303
-
304
-
305
-
306
-
307
-
308
-
309
-
310
-
311
-
312
-
313
-
314
-
315
-
316
-
317
-
318
-
319
-
320
-
321
-
322
-
323
-
324
-
325
-
326
-
327
-
328
-
329
-
330
-
331
-
332
-
333
-
334
-
 335
335 -
 336
336 -
 337
337 -
 338
338 -
 339
339 -
 340
340 -
 341
341 -
 342
342 -
 343
343 -
 344
344 -
 345
345 -
346
-
347
-
348
-
349
-
350
-
351
-
352
-
353
-
354
-
355
-
356
-
357
-
358
-
359
-
360
-
361
-
362
-
363
-
364
-
365
-
366
-
367
-
368
-
369
-
370
-
371
-
372
-
373
-
374
-
375
-
376
-
377
-
378
-
379
-
380
-
381
-
382
-
383
-
384
-
385
-
386
-
387
-
388
-
389
-
390
-
391
-
392
-
393
-
394
-
395
-
396
-
397
-
398
-
399
-
400
-
401
-
402
-
403
-
404
-
405
-
406
-
407
-
408
-
409
-
410
-
411
-
412
-
413
-
414
-
415
-
416
-
417
-
418
-
419
-
420
-
421
-
422
-
423
-
424
-
425
-
426
-
427
-
428
-
429
-
430
-
431
-
432
-
433
-
434
-
435
-
436
-
437
-
438
-
439
-
440
-
441
-
442
-
443
-
444
-
445
-
446
-
447
-
448
-
449
-
450
-
451
-
452
-
453
-
454
-
455
-
456
-
457
-
458
-
459
-
460
-
461
-
462
-
463
-
464
-
465
-
466
-
467
-
468
-
469
-
470
-
471
-
472
-
473
-
474
-
475
-
476
-
477
-
478
-
479
-
480
-
481
-
482
-
483
-
484
-
485
-
486
-
487
-
488
-
489
-
490
-
491
-
492
 |
 |