HP StorageWorks 2/16V Brocade Web Tools Administrator's Guide - Supporting Fab - Page 143
Monitoring Performance, In this Monitoring performance using Web Tools
 |
View all HP StorageWorks 2/16V manuals
Add to My Manuals
Save this manual to your list of manuals |
Page 143 highlights
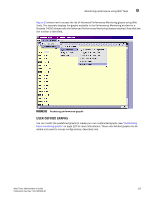
Monitoring Performance Chapter 9 In this chapter This chapter contains the following sections: • Monitoring performance using Web Tools 121 • Opening the Performance Monitoring window . . . . 126 • Creating basic performance monitor graphs . . . . . 127 • Customizing basic monitoring graphs 127 • Creating advanced performance monitoring graphs 129 • Managing performance graphs 132 Monitoring performance using Web Tools The Web Tools Performance Monitoring window graphically displays throughput (in megabytes per second) for each port and for the entire switch. The basic-mode Performance Monitor is standard in the Web Tools software. Any user logged into Web tools with an associated role of zoneadmin or securityadmin cannot open performance monitor. The roles user, operator, and basicswitchadmin are allowed to perform basic-mode performance monitor tasks except save or display canvas operations in any Admin Domain context. Only users with the admin, switchadmin and fabricadmin roles associated with their login accounts are able to save or display a canvas. The Advanced Monitoring menu in performance monitor is an optionally licensed software. To utilize the Advanced Monitoring feature you must have a license installed and you must log in using an account that has an admin, switchadmin, or fabricadmin role. Use the basic-mode Performance Monitoring window to: • Create user-definable reports. • Display a performance canvas for application-level or fabric-level views. • Save persistent graphs across reboots (saves parameter data across reboots). Using Brocade Advanced Performance Monitoring, you can display predefined reports for AL_PA, end-to-end, and filter-based performance monitoring. You can track: • The number of CRC errors for AL_PA devices. • The number of words received and transmitted in Fibre Channel frames with a defined S_ID/D_ID pair. • The number of times a particular filter pattern in a frame is transmitted by a port. For detailed information on performance monitoring, see the Fabric OS Administrator's Guide. Each graph is displayed individually in a window, so it can be minimized, maximized, resized, and closed. Web Tools Administrator's Guide 121 Publication Number: 53-1000435-01
-
 1
1 -
2
-
3
-
4
-
5
-
6
-
7
-
8
-
9
-
10
-
11
-
12
-
13
-
14
-
15
-
16
-
17
-
18
-
19
-
20
-
21
-
22
-
23
-
24
-
25
-
26
-
27
-
28
-
29
-
30
-
31
-
32
-
33
-
34
-
35
-
36
-
37
-
38
-
39
-
40
-
41
-
42
-
43
-
44
-
45
-
46
-
47
-
48
-
49
-
50
-
51
-
52
-
53
-
54
-
55
-
56
-
57
-
58
-
59
-
60
-
61
-
62
-
63
-
64
-
65
-
66
-
67
-
68
-
69
-
70
-
71
-
72
-
73
-
74
-
75
-
76
-
77
-
78
-
79
-
80
-
81
-
82
-
83
-
84
-
85
-
86
-
87
-
88
-
89
-
90
-
91
-
92
-
93
-
94
-
95
-
96
-
97
-
98
-
99
-
100
-
101
-
102
-
103
-
104
-
105
-
106
-
107
-
108
-
109
-
110
-
111
-
112
-
113
-
114
-
115
-
116
-
117
-
118
-
119
-
120
-
121
-
122
-
123
-
124
-
125
-
126
-
127
-
128
-
129
-
130
-
131
-
132
-
133
-
134
-
135
-
136
-
137
-
 138
138 -
 139
139 -
 140
140 -
 141
141 -
 142
142 -
 143
143 -
 144
144 -
 145
145 -
 146
146 -
 147
147 -
 148
148 -
149
-
150
-
151
-
152
-
153
-
154
-
155
-
156
-
157
-
158
-
159
-
160
-
161
-
162
-
163
-
164
-
165
-
166
-
167
-
168
-
169
-
170
-
171
-
172
-
173
-
174
-
175
-
176
-
177
-
178
-
179
-
180
-
181
-
182
-
183
-
184
-
185
-
186
-
187
-
188
-
189
-
190
-
191
-
192
-
193
-
194
-
195
-
196
-
197
-
198
-
199
-
200
-
201
-
202
-
203
-
204
-
205
-
206
-
207
-
208
-
209
-
210
-
211
-
212
-
213
-
214
-
215
-
216
-
217
-
218
-
219
-
220
-
221
-
222
-
223
-
224
-
225
-
226
-
227
-
228
-
229
-
230
-
231
-
232
-
233
-
234
-
235
-
236
-
237
-
238
-
239
-
240
-
241
-
242
-
243
-
244
-
245
-
246
-
247
-
248
-
249
-
250
-
251
-
252
-
253
-
254
-
255
-
256
-
257
-
258
-
259
-
260
-
261
-
262
-
263
-
264
-
265
-
266
 |
 |