HP StorageWorks 2/16V Brocade Web Tools Administrator's Guide - Supporting Fab - Page 71
Displaying Fabric Events
 |
View all HP StorageWorks 2/16V manuals
Add to My Manuals
Save this manual to your list of manuals |
Page 71 highlights
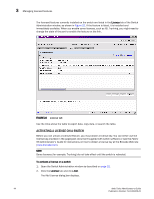
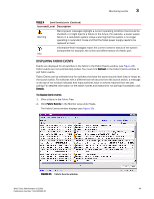
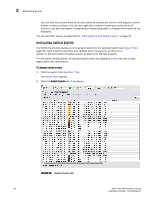
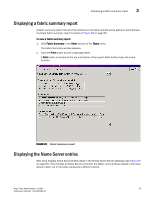
Monitoring events 3 TABLE 4 Event Severity Levels (Continued) Icon and Level Description Warning Warning-level messages highlight a current operating condition that should be checked or it might lead to a failure in the future. For example, a power supply failure in a redundant system relays a warning that the system is no longer operating in redundant mode and that the failed power supply needs to be replaced or fixed. Information-level messages report the current nonerror status of the system components; for example, the online and offline status of a fabric port. Info DISPLAYING FABRIC EVENTS Events are displayed for all switches in the fabric in the Fabric Events window (see Figure 25). Fabric events are not automatically polled. You must click Refresh in the Fabric Events window to poll fabric events. Fabric Events can be collected only for switches that have the same security level (http or https) as the launch switch. For switches with a different level of security from the launch switch, a message at the top of the window indicates how many switches have no events reported from the last polling. For detailed information on the switch names and reasons for not polling (if available), click Details. To display fabric events 1. Click a fabric in the Fabric Tree. 2. Click Fabric Events in the Monitor area under Tasks. The Fabric Events window displays (see Figure 25). FIGURE 25 Fabric Events window Web Tools Administrator's Guide 49 Publication Number: 53-1000435-01
-
 1
1 -
2
-
3
-
4
-
5
-
6
-
7
-
8
-
9
-
10
-
11
-
12
-
13
-
14
-
15
-
16
-
17
-
18
-
19
-
20
-
21
-
22
-
23
-
24
-
25
-
26
-
27
-
28
-
29
-
30
-
31
-
32
-
33
-
34
-
35
-
36
-
37
-
38
-
39
-
40
-
41
-
42
-
43
-
44
-
45
-
46
-
47
-
48
-
49
-
50
-
51
-
52
-
53
-
54
-
55
-
56
-
57
-
58
-
59
-
60
-
61
-
62
-
63
-
64
-
65
-
 66
66 -
 67
67 -
 68
68 -
 69
69 -
 70
70 -
 71
71 -
 72
72 -
 73
73 -
 74
74 -
 75
75 -
 76
76 -
77
-
78
-
79
-
80
-
81
-
82
-
83
-
84
-
85
-
86
-
87
-
88
-
89
-
90
-
91
-
92
-
93
-
94
-
95
-
96
-
97
-
98
-
99
-
100
-
101
-
102
-
103
-
104
-
105
-
106
-
107
-
108
-
109
-
110
-
111
-
112
-
113
-
114
-
115
-
116
-
117
-
118
-
119
-
120
-
121
-
122
-
123
-
124
-
125
-
126
-
127
-
128
-
129
-
130
-
131
-
132
-
133
-
134
-
135
-
136
-
137
-
138
-
139
-
140
-
141
-
142
-
143
-
144
-
145
-
146
-
147
-
148
-
149
-
150
-
151
-
152
-
153
-
154
-
155
-
156
-
157
-
158
-
159
-
160
-
161
-
162
-
163
-
164
-
165
-
166
-
167
-
168
-
169
-
170
-
171
-
172
-
173
-
174
-
175
-
176
-
177
-
178
-
179
-
180
-
181
-
182
-
183
-
184
-
185
-
186
-
187
-
188
-
189
-
190
-
191
-
192
-
193
-
194
-
195
-
196
-
197
-
198
-
199
-
200
-
201
-
202
-
203
-
204
-
205
-
206
-
207
-
208
-
209
-
210
-
211
-
212
-
213
-
214
-
215
-
216
-
217
-
218
-
219
-
220
-
221
-
222
-
223
-
224
-
225
-
226
-
227
-
228
-
229
-
230
-
231
-
232
-
233
-
234
-
235
-
236
-
237
-
238
-
239
-
240
-
241
-
242
-
243
-
244
-
245
-
246
-
247
-
248
-
249
-
250
-
251
-
252
-
253
-
254
-
255
-
256
-
257
-
258
-
259
-
260
-
261
-
262
-
263
-
264
-
265
-
266
 |
 |
