HP StorageWorks 2/16V Brocade Web Tools Administrator's Guide - Supporting Fab - Page 9

Using the FC-FC Routing Service, Working With Diagnostic Features

Page 9 highlights

Chapter 10 Chapter 11 Chapter 12 Web Tools Administrator's Guide Publication Number: 53-1000435-01 Opening the Performance Monitoring window 126 Creating basic performance monitor graphs 127 Customizing basic monitoring graphs 127 Creating advanced performance monitoring graphs 129 Creating SID-DID Performance Graphs 129 Creating an SCSI vs. IP Traffic Graph 130 Creating SCSI Command Graphs 131 Creating AL_PA Error Graphs 132 Managing performance graphs 132 Saving graphs to a canvas 132 Adding graphs to a canvas 133 Printing graphs 133 Modifying graphs 134 Using the FC-FC Routing Service In this chapter 135 Supported switches for fibre channel routing 135 About fibre channel routing 135 McData interoperability 136 Setting up FC-FC routing 137 Managing FC-FC routing with Web Tools 138 Launching the FC Routing module 138 Viewing and managing LSAN fabrics 139 Viewing and configuring EX_Ports 140 Viewing and configuring FCR router port cost 142 Viewing and configuring LSAN zones 142 Viewing LSAN Devices 143 Configuring the backbone fabric ID 144 Working With Diagnostic Features In this chapter 147 Managing trace dumps 147 How a trace dump Is used 148 Setting up automatic trace dump transfers 148 Disabling automatic trace uploads 149 Displaying switch information 149 Displaying detailed fan hardware status 150 Displaying the temperature status 151 Displaying the power supply status 151 Checking the physical health of a switch 152 Interpreting port LEDs 154 Port icon colors 155 LED representations 155 Brocade 48000 Director LEDs 156 Administering Fabric Watch In this chapter 157 Introduction to Fabric Watch 157 Using Fabric Watch with Web Tools 158 v

  • 1
  • 2
  • 3
  • 4
  • 5
  • 6
  • 7
  • 8
  • 9
  • 10
  • 11
  • 12
  • 13
  • 14
  • 15
  • 16
  • 17
  • 18
  • 19
  • 20
  • 21
  • 22
  • 23
  • 24
  • 25
  • 26
  • 27
  • 28
  • 29
  • 30
  • 31
  • 32
  • 33
  • 34
  • 35
  • 36
  • 37
  • 38
  • 39
  • 40
  • 41
  • 42
  • 43
  • 44
  • 45
  • 46
  • 47
  • 48
  • 49
  • 50
  • 51
  • 52
  • 53
  • 54
  • 55
  • 56
  • 57
  • 58
  • 59
  • 60
  • 61
  • 62
  • 63
  • 64
  • 65
  • 66
  • 67
  • 68
  • 69
  • 70
  • 71
  • 72
  • 73
  • 74
  • 75
  • 76
  • 77
  • 78
  • 79
  • 80
  • 81
  • 82
  • 83
  • 84
  • 85
  • 86
  • 87
  • 88
  • 89
  • 90
  • 91
  • 92
  • 93
  • 94
  • 95
  • 96
  • 97
  • 98
  • 99
  • 100
  • 101
  • 102
  • 103
  • 104
  • 105
  • 106
  • 107
  • 108
  • 109
  • 110
  • 111
  • 112
  • 113
  • 114
  • 115
  • 116
  • 117
  • 118
  • 119
  • 120
  • 121
  • 122
  • 123
  • 124
  • 125
  • 126
  • 127
  • 128
  • 129
  • 130
  • 131
  • 132
  • 133
  • 134
  • 135
  • 136
  • 137
  • 138
  • 139
  • 140
  • 141
  • 142
  • 143
  • 144
  • 145
  • 146
  • 147
  • 148
  • 149
  • 150
  • 151
  • 152
  • 153
  • 154
  • 155
  • 156
  • 157
  • 158
  • 159
  • 160
  • 161
  • 162
  • 163
  • 164
  • 165
  • 166
  • 167
  • 168
  • 169
  • 170
  • 171
  • 172
  • 173
  • 174
  • 175
  • 176
  • 177
  • 178
  • 179
  • 180
  • 181
  • 182
  • 183
  • 184
  • 185
  • 186
  • 187
  • 188
  • 189
  • 190
  • 191
  • 192
  • 193
  • 194
  • 195
  • 196
  • 197
  • 198
  • 199
  • 200
  • 201
  • 202
  • 203
  • 204
  • 205
  • 206
  • 207
  • 208
  • 209
  • 210
  • 211
  • 212
  • 213
  • 214
  • 215
  • 216
  • 217
  • 218
  • 219
  • 220
  • 221
  • 222
  • 223
  • 224
  • 225
  • 226
  • 227
  • 228
  • 229
  • 230
  • 231
  • 232
  • 233
  • 234
  • 235
  • 236
  • 237
  • 238
  • 239
  • 240
  • 241
  • 242
  • 243
  • 244
  • 245
  • 246
  • 247
  • 248
  • 249
  • 250
  • 251
  • 252
  • 253
  • 254
  • 255
  • 256
  • 257
  • 258
  • 259
  • 260
  • 261
  • 262
  • 263
  • 264
  • 265
  • 266

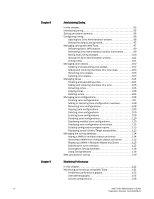
Web Tools Administrator’s Guide
v
Publication Number: 53-1000435-01
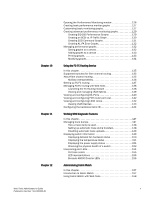
Opening the Performance Monitoring window . . . . . . . . . . . . . . . .126
Creating basic performance monitor graphs . . . . . . . . . . . . . . . . .127
Customizing basic monitoring graphs . . . . . . . . . . . . . . . . . . . . . . .127
Creating advanced performance monitoring graphs . . . . . . . . . . .129
Creating SID-DID Performance Graphs . . . . . . . . . . . . . . . . . .129
Creating an SCSI vs. IP Traffic Graph . . . . . . . . . . . . . . . . . . . .130
Creating SCSI Command Graphs . . . . . . . . . . . . . . . . . . . . . . .131
Creating AL_PA Error Graphs. . . . . . . . . . . . . . . . . . . . . . . . . . .132
Managing performance graphs . . . . . . . . . . . . . . . . . . . . . . . . . . . .132
Saving graphs to a canvas. . . . . . . . . . . . . . . . . . . . . . . . . . . . .132
Adding graphs to a canvas . . . . . . . . . . . . . . . . . . . . . . . . . . . .133
Printing graphs. . . . . . . . . . . . . . . . . . . . . . . . . . . . . . . . . . . . . .133
Modifying graphs . . . . . . . . . . . . . . . . . . . . . . . . . . . . . . . . . . . .134
Chapter 10
Using the FC-FC Routing Service
In this chapter . . . . . . . . . . . . . . . . . . . . . . . . . . . . . . . . . . . . . . . . . .135
Supported switches for fibre channel routing. . . . . . . . . . . . . . . . .135
About fibre channel routing . . . . . . . . . . . . . . . . . . . . . . . . . . . . . . .135
McData interoperability . . . . . . . . . . . . . . . . . . . . . . . . . . . . . . .136
Setting up FC-FC routing . . . . . . . . . . . . . . . . . . . . . . . . . . . . . . . . . .137
Managing FC-FC routing with Web Tools . . . . . . . . . . . . . . . . . . . . .138
Launching the FC Routing module . . . . . . . . . . . . . . . . . . . . . .138
Viewing and managing LSAN fabrics . . . . . . . . . . . . . . . . . . . .139
Viewing and configuring EX_Ports . . . . . . . . . . . . . . . . . . . . . . . . . .140
Viewing and configuring FCR router port cost. . . . . . . . . . . . . . . . .142
Viewing and configuring LSAN zones. . . . . . . . . . . . . . . . . . . . . . . .142
Viewing LSAN Devices . . . . . . . . . . . . . . . . . . . . . . . . . . . . . . . .143
Configuring the backbone fabric ID . . . . . . . . . . . . . . . . . . . . . . . . .144
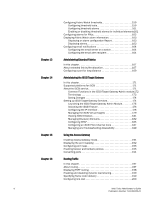
Chapter 11
Working With Diagnostic Features
In this chapter . . . . . . . . . . . . . . . . . . . . . . . . . . . . . . . . . . . . . . . . . .147
Managing trace dumps. . . . . . . . . . . . . . . . . . . . . . . . . . . . . . . . . . .147
How a trace dump Is used. . . . . . . . . . . . . . . . . . . . . . . . . . . . .148
Setting up automatic trace dump transfers . . . . . . . . . . . . . . .148
Disabling automatic trace uploads. . . . . . . . . . . . . . . . . . . . . .149
Displaying switch information . . . . . . . . . . . . . . . . . . . . . . . . . . . . .149
Displaying detailed fan hardware status . . . . . . . . . . . . . . . . .150
Displaying the temperature status . . . . . . . . . . . . . . . . . . . . . .151
Displaying the power supply status . . . . . . . . . . . . . . . . . . . . .151
Checking the physical health of a switch . . . . . . . . . . . . . . . . .152
Interpreting port LEDs. . . . . . . . . . . . . . . . . . . . . . . . . . . . . . . . . . . .154
Port icon colors . . . . . . . . . . . . . . . . . . . . . . . . . . . . . . . . . . . . .155
LED representations . . . . . . . . . . . . . . . . . . . . . . . . . . . . . . . . .155
Brocade 48000 Director LEDs . . . . . . . . . . . . . . . . . . . . . . . . .156
Chapter 12
Administering Fabric Watch
In this chapter . . . . . . . . . . . . . . . . . . . . . . . . . . . . . . . . . . . . . . . . . .157
Introduction to Fabric Watch . . . . . . . . . . . . . . . . . . . . . . . . . . . . . .157
Using Fabric Watch with Web Tools . . . . . . . . . . . . . . . . . . . . . . . . .158