HP StorageWorks 2/16V Brocade Web Tools Administrator's Guide - Supporting Fab - Page 150
For Brocade 200E
 |
View all HP StorageWorks 2/16V manuals
Add to My Manuals
Save this manual to your list of manuals |
Page 150 highlights
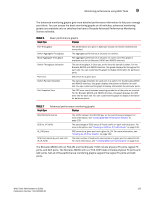
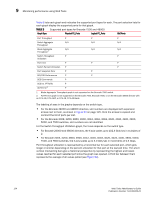
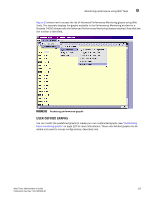
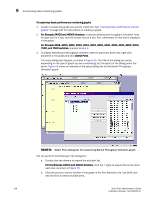
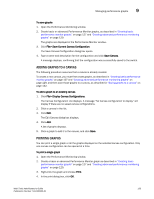
9 Customizing basic monitoring graphs To customize basic performance monitoring graphs 1. Create or access the graph you want to customize. See "Creating basic performance monitor graphs" on page 127 for instructions on creating a graph. 2. For Brocade 24000 and 48000 directors, to display detailed port throughput utilization rates for each port in a slot, click the arrows next to a slot. Port information for that slot is displayed in the graph. For Brocade 200E, 3250, 3850, 3900, 4012, 4016, 4018, 4020, 4024, 4100, 4900, 5000, 7500, and 7600 switches, proceed to step 3. 3. To display detailed port throughput utilization rates for particular ports only, right-click anywhere in the graph.and click Select Ports. The setup dialog box displays, as shown in Figure 55. The title of the dialog box varies, depending on the type of graph you are customizing, but the layout of the dialog box is the same. Figure 55 shows an example of the setup dialog box for the Switch Throughput Utilization graph. FIGURE 55 Select Ports dialog box for customizing Switch Throughput Utilization graph You can perform the following in the dialog box: a. Double-click the domain to expand the slot/port list. For the Brocade 24000 and 48000 directors, click the + signs to expand the ports under each slot, as shown in Figure 55. b. Click the port you want to monitor in the graph in the Port Selection List. Use Shift-click and Ctrl-click to select multiple ports. 128 Web Tools Administrator's Guide Publication Number: 53-1000435-01
-
 1
1 -
2
-
3
-
4
-
5
-
6
-
7
-
8
-
9
-
10
-
11
-
12
-
13
-
14
-
15
-
16
-
17
-
18
-
19
-
20
-
21
-
22
-
23
-
24
-
25
-
26
-
27
-
28
-
29
-
30
-
31
-
32
-
33
-
34
-
35
-
36
-
37
-
38
-
39
-
40
-
41
-
42
-
43
-
44
-
45
-
46
-
47
-
48
-
49
-
50
-
51
-
52
-
53
-
54
-
55
-
56
-
57
-
58
-
59
-
60
-
61
-
62
-
63
-
64
-
65
-
66
-
67
-
68
-
69
-
70
-
71
-
72
-
73
-
74
-
75
-
76
-
77
-
78
-
79
-
80
-
81
-
82
-
83
-
84
-
85
-
86
-
87
-
88
-
89
-
90
-
91
-
92
-
93
-
94
-
95
-
96
-
97
-
98
-
99
-
100
-
101
-
102
-
103
-
104
-
105
-
106
-
107
-
108
-
109
-
110
-
111
-
112
-
113
-
114
-
115
-
116
-
117
-
118
-
119
-
120
-
121
-
122
-
123
-
124
-
125
-
126
-
127
-
128
-
129
-
130
-
131
-
132
-
133
-
134
-
135
-
136
-
137
-
138
-
139
-
140
-
141
-
142
-
143
-
144
-
 145
145 -
 146
146 -
 147
147 -
 148
148 -
 149
149 -
 150
150 -
 151
151 -
 152
152 -
 153
153 -
 154
154 -
 155
155 -
156
-
157
-
158
-
159
-
160
-
161
-
162
-
163
-
164
-
165
-
166
-
167
-
168
-
169
-
170
-
171
-
172
-
173
-
174
-
175
-
176
-
177
-
178
-
179
-
180
-
181
-
182
-
183
-
184
-
185
-
186
-
187
-
188
-
189
-
190
-
191
-
192
-
193
-
194
-
195
-
196
-
197
-
198
-
199
-
200
-
201
-
202
-
203
-
204
-
205
-
206
-
207
-
208
-
209
-
210
-
211
-
212
-
213
-
214
-
215
-
216
-
217
-
218
-
219
-
220
-
221
-
222
-
223
-
224
-
225
-
226
-
227
-
228
-
229
-
230
-
231
-
232
-
233
-
234
-
235
-
236
-
237
-
238
-
239
-
240
-
241
-
242
-
243
-
244
-
245
-
246
-
247
-
248
-
249
-
250
-
251
-
252
-
253
-
254
-
255
-
256
-
257
-
258
-
259
-
260
-
261
-
262
-
263
-
264
-
265
-
266
 |
 |
