HP StorageWorks 2/16V Brocade Web Tools Administrator's Guide - Supporting Fab - Page 44
Switch Events and Switch Information, Displaying tool tips, Switch View refresh rates
 |
View all HP StorageWorks 2/16V manuals
Add to My Manuals
Save this manual to your list of manuals |
Page 44 highlights
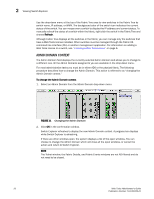
2 Displaying tool tips If the selected Admin Domain does not include ownership of some ports that are physically present on the switch, these ports are represented as black rectangles with horizontal gray bars indicating they are not accessible. E_Ports are visible in all domains. You cannot launch the Port Management module by clicking these ports. In Figure 12, only ports 16 through 31 (and not the switch) are owned by the current Admin Domain, as shown in the figure: • E_Ports 0, 1, 14, 24, and 25 are shown as online and accessible. • All other ports in the range from 0 through 15 are shown as inaccessible, with no type information displayed. If you click the E_Ports in this range, the Port Management module launches in read-only mode. • Ports in the range from 16 through 31 are both accessible and controllable. When these ports (including E_Ports) are clicked, the Port Management module launches in read-write mode. Switch View refresh rates The Switch View display is refreshed at 15 second intervals. However, the initial display of Switch Explorer might take from 30 to 60 seconds after the switch is booted. Refresh rates are fabric-size dependent. The larger the fabric, the longer it takes to poll the fabric and refresh the view. F_Port and L_Port connection changes refresh immediately. Autorefresh intervals may be not be exactly 15 seconds. The refresh rate varies depending on the activity in the fabric and on the host system you are using. SWITCH EVENTS AND SWITCH INFORMATION Switch Events and Switch Information appear as tab forms under Switch View. Switch Information View displays switch information such as switch name, status, Fabric OS version, domain ID, IP address, WWN, and current zone configuration. The information in the Switch Information View is polled every 60 seconds. For more information, see "Displaying switch information" on page 149. Displaying tool tips If you hover your cursor most components, the system displays tool tip information about the component. Figure 13 shows several examples of tool tips. In Fabric Tree you can hover over a switch to view its type, Ethernet IP, Fibre Channel IP, and status of the switch. In Switch View, you can hover over a blade to view the blade ID and its status. It is easier to use the top of the blade to display the tool tip so that you do not inadvertently display the port tool tips. When you hover over a port, you can view the port number, port index, port type (E, F, L, or U_Port), port status (online or offline), and port state (in-sync, no_sync, no light, or no module). If you rightclick the port, the system displays the tool tip information as well as the port world-wide name. For example, Figure 13 displays the mouseover tool tip for port 19 and the right-click tool tip for port 30. 22 Web Tools Administrator's Guide Publication Number: 53-1000435-01
-
 1
1 -
2
-
3
-
4
-
5
-
6
-
7
-
8
-
9
-
10
-
11
-
12
-
13
-
14
-
15
-
16
-
17
-
18
-
19
-
20
-
21
-
22
-
23
-
24
-
25
-
26
-
27
-
28
-
29
-
30
-
31
-
32
-
33
-
34
-
35
-
36
-
37
-
38
-
 39
39 -
 40
40 -
 41
41 -
 42
42 -
 43
43 -
 44
44 -
 45
45 -
 46
46 -
 47
47 -
 48
48 -
 49
49 -
50
-
51
-
52
-
53
-
54
-
55
-
56
-
57
-
58
-
59
-
60
-
61
-
62
-
63
-
64
-
65
-
66
-
67
-
68
-
69
-
70
-
71
-
72
-
73
-
74
-
75
-
76
-
77
-
78
-
79
-
80
-
81
-
82
-
83
-
84
-
85
-
86
-
87
-
88
-
89
-
90
-
91
-
92
-
93
-
94
-
95
-
96
-
97
-
98
-
99
-
100
-
101
-
102
-
103
-
104
-
105
-
106
-
107
-
108
-
109
-
110
-
111
-
112
-
113
-
114
-
115
-
116
-
117
-
118
-
119
-
120
-
121
-
122
-
123
-
124
-
125
-
126
-
127
-
128
-
129
-
130
-
131
-
132
-
133
-
134
-
135
-
136
-
137
-
138
-
139
-
140
-
141
-
142
-
143
-
144
-
145
-
146
-
147
-
148
-
149
-
150
-
151
-
152
-
153
-
154
-
155
-
156
-
157
-
158
-
159
-
160
-
161
-
162
-
163
-
164
-
165
-
166
-
167
-
168
-
169
-
170
-
171
-
172
-
173
-
174
-
175
-
176
-
177
-
178
-
179
-
180
-
181
-
182
-
183
-
184
-
185
-
186
-
187
-
188
-
189
-
190
-
191
-
192
-
193
-
194
-
195
-
196
-
197
-
198
-
199
-
200
-
201
-
202
-
203
-
204
-
205
-
206
-
207
-
208
-
209
-
210
-
211
-
212
-
213
-
214
-
215
-
216
-
217
-
218
-
219
-
220
-
221
-
222
-
223
-
224
-
225
-
226
-
227
-
228
-
229
-
230
-
231
-
232
-
233
-
234
-
235
-
236
-
237
-
238
-
239
-
240
-
241
-
242
-
243
-
244
-
245
-
246
-
247
-
248
-
249
-
250
-
251
-
252
-
253
-
254
-
255
-
256
-
257
-
258
-
259
-
260
-
261
-
262
-
263
-
264
-
265
-
266
 |
 |