HP StorageWorks 2/16V Brocade Web Tools Administrator's Guide - Supporting Fab - Page 146
Monitoring performance using Web Tools, For the Brocade 200E
 |
View all HP StorageWorks 2/16V manuals
Add to My Manuals
Save this manual to your list of manuals |
Page 146 highlights
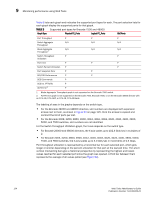
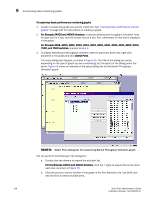
9 Monitoring performance using Web Tools Table 8 lists each graph and indicates the supported port types for each. The port selection lists for each graph display the supported ports for that graph. TABLE 8 Supported port types for Brocade 7500 and 48000 Graph Type Physical FC_Ports Logical FC_Ports GbE Ports Port Throughput P P P Switch Aggregate N/A N/A N/A Throughput Blade Aggregate N/A N/A N/A Throughput1 Switch Throughput P P Utilization Port Error P P P Switch Percent Utilization P P Port Snapshot Error P P SID/DID Performance P P SCSI Commands P SCSI vs. IP Traffic P ALPA Error2 P 1. Blade Aggregate Throughput graph is not supported on the Brocade 7500 switch. 2. ALPA Error graph is not supported on the Brocade 7500, Brocade 7600, or on the Brocade 48000 director with an FC4-18i, FC4-16IP, or FC4-18, FC4-48 blade. The labeling of axes in the graphs depends on the switch type. • For the Brocade 24000 and 48000 directors, slot numbers are displayed with expansion arrows next to them, as shown in Figure 52 on page 125. Click the arrows to expand and contract the list of ports per slot. • For the Brocade 200E, 3250, 3850, 3900, 4012, 4016, 4018, 4020, 4024, 4100, 4900, 5000, and 7500 switches, slot numbers are not identified. For the Switch Throughput Utilization graph, the X-axis depends on the switch type. • For Brocade 24000 and 48000 directors, the X-axis scales up to 102.4 Gbit/sec in multiples of 2. • For Brocade 200E, 3250, 3850, 3900, 4012, 4016, 4018, 4020, 4024, 4100, 4900, 5000, 7500, and 7600 switches, the X-axis scales up to 4.0 Gbit/sec in increments of 0.4 Gbps. Port throughput utilization is represented by a horizontal bar for each selected port, which gets longer or shorter depending on the percent utilization for that port at the last poll time. Thin short vertical intersecting bars give a historical perspective by representing the highest and lowest values reached for each selected port since the graph was opened. A third bar between them represents the average of all values polled (see Figure 52). 124 Web Tools Administrator's Guide Publication Number: 53-1000435-01
-
 1
1 -
2
-
3
-
4
-
5
-
6
-
7
-
8
-
9
-
10
-
11
-
12
-
13
-
14
-
15
-
16
-
17
-
18
-
19
-
20
-
21
-
22
-
23
-
24
-
25
-
26
-
27
-
28
-
29
-
30
-
31
-
32
-
33
-
34
-
35
-
36
-
37
-
38
-
39
-
40
-
41
-
42
-
43
-
44
-
45
-
46
-
47
-
48
-
49
-
50
-
51
-
52
-
53
-
54
-
55
-
56
-
57
-
58
-
59
-
60
-
61
-
62
-
63
-
64
-
65
-
66
-
67
-
68
-
69
-
70
-
71
-
72
-
73
-
74
-
75
-
76
-
77
-
78
-
79
-
80
-
81
-
82
-
83
-
84
-
85
-
86
-
87
-
88
-
89
-
90
-
91
-
92
-
93
-
94
-
95
-
96
-
97
-
98
-
99
-
100
-
101
-
102
-
103
-
104
-
105
-
106
-
107
-
108
-
109
-
110
-
111
-
112
-
113
-
114
-
115
-
116
-
117
-
118
-
119
-
120
-
121
-
122
-
123
-
124
-
125
-
126
-
127
-
128
-
129
-
130
-
131
-
132
-
133
-
134
-
135
-
136
-
137
-
138
-
139
-
140
-
 141
141 -
 142
142 -
 143
143 -
 144
144 -
 145
145 -
 146
146 -
 147
147 -
 148
148 -
 149
149 -
 150
150 -
 151
151 -
152
-
153
-
154
-
155
-
156
-
157
-
158
-
159
-
160
-
161
-
162
-
163
-
164
-
165
-
166
-
167
-
168
-
169
-
170
-
171
-
172
-
173
-
174
-
175
-
176
-
177
-
178
-
179
-
180
-
181
-
182
-
183
-
184
-
185
-
186
-
187
-
188
-
189
-
190
-
191
-
192
-
193
-
194
-
195
-
196
-
197
-
198
-
199
-
200
-
201
-
202
-
203
-
204
-
205
-
206
-
207
-
208
-
209
-
210
-
211
-
212
-
213
-
214
-
215
-
216
-
217
-
218
-
219
-
220
-
221
-
222
-
223
-
224
-
225
-
226
-
227
-
228
-
229
-
230
-
231
-
232
-
233
-
234
-
235
-
236
-
237
-
238
-
239
-
240
-
241
-
242
-
243
-
244
-
245
-
246
-
247
-
248
-
249
-
250
-
251
-
252
-
253
-
254
-
255
-
256
-
257
-
258
-
259
-
260
-
261
-
262
-
263
-
264
-
265
-
266
 |
 |