HP StorageWorks 2/16V Brocade Web Tools Administrator's Guide - Supporting Fab - Page 169
Working With Diagnostic Features, In this Managing trace dumps
 |
View all HP StorageWorks 2/16V manuals
Add to My Manuals
Save this manual to your list of manuals |
Page 169 highlights
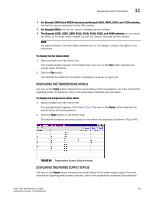
Chapter Working With Diagnostic Features 11 In this chapter This chapter contains the following information: • Managing trace dumps 147 • Displaying switch information 149 • Interpreting port LEDs 154 Managing trace dumps A trace dump is a snapshot of the running behavior within the Brocade switch. The dump can be used by developers and troubleshooters at Brocade to help understand what might be contributing to a specific switch behavior when certain internal events are seen. For example, a trace dump can be created each time a certain error message is logged to the system error log. Developers can then examine what led up to the message event by studying the traces. Tracing is always "on." As software on the switch executes, the trace information is placed into a circular buffer in system RAM. Periodically, the trace buffer is "frozen" and saved. This saved information is a "trace dump." A trace dump is generated when: • It is triggered manually (use the traceDump command). • A critical-level LOG message occurs. • A particular LOG message occurs (use the traceTrig command to set up the conditions for this). • A kernel panic occurs. • The hardware watchdog timer expires. (For information about the traceDump and traceTrig commands, see the Fabric OS Command Reference.) The trace dump is maintained on the switch until either it is uploaded to the FTP host or another trace dump is generated. If another trace dump is generated before the previous one is uploaded, the previous dump is overwritten. When a trace dump is generated, it is automatically uploaded to an FTP host if automatic FTP uploading is enabled. Web Tools Administrator's Guide 147 Publication Number: 53-1000435-01
-
 1
1 -
2
-
3
-
4
-
5
-
6
-
7
-
8
-
9
-
10
-
11
-
12
-
13
-
14
-
15
-
16
-
17
-
18
-
19
-
20
-
21
-
22
-
23
-
24
-
25
-
26
-
27
-
28
-
29
-
30
-
31
-
32
-
33
-
34
-
35
-
36
-
37
-
38
-
39
-
40
-
41
-
42
-
43
-
44
-
45
-
46
-
47
-
48
-
49
-
50
-
51
-
52
-
53
-
54
-
55
-
56
-
57
-
58
-
59
-
60
-
61
-
62
-
63
-
64
-
65
-
66
-
67
-
68
-
69
-
70
-
71
-
72
-
73
-
74
-
75
-
76
-
77
-
78
-
79
-
80
-
81
-
82
-
83
-
84
-
85
-
86
-
87
-
88
-
89
-
90
-
91
-
92
-
93
-
94
-
95
-
96
-
97
-
98
-
99
-
100
-
101
-
102
-
103
-
104
-
105
-
106
-
107
-
108
-
109
-
110
-
111
-
112
-
113
-
114
-
115
-
116
-
117
-
118
-
119
-
120
-
121
-
122
-
123
-
124
-
125
-
126
-
127
-
128
-
129
-
130
-
131
-
132
-
133
-
134
-
135
-
136
-
137
-
138
-
139
-
140
-
141
-
142
-
143
-
144
-
145
-
146
-
147
-
148
-
149
-
150
-
151
-
152
-
153
-
154
-
155
-
156
-
157
-
158
-
159
-
160
-
161
-
162
-
163
-
 164
164 -
 165
165 -
 166
166 -
 167
167 -
 168
168 -
 169
169 -
 170
170 -
 171
171 -
 172
172 -
 173
173 -
 174
174 -
175
-
176
-
177
-
178
-
179
-
180
-
181
-
182
-
183
-
184
-
185
-
186
-
187
-
188
-
189
-
190
-
191
-
192
-
193
-
194
-
195
-
196
-
197
-
198
-
199
-
200
-
201
-
202
-
203
-
204
-
205
-
206
-
207
-
208
-
209
-
210
-
211
-
212
-
213
-
214
-
215
-
216
-
217
-
218
-
219
-
220
-
221
-
222
-
223
-
224
-
225
-
226
-
227
-
228
-
229
-
230
-
231
-
232
-
233
-
234
-
235
-
236
-
237
-
238
-
239
-
240
-
241
-
242
-
243
-
244
-
245
-
246
-
247
-
248
-
249
-
250
-
251
-
252
-
253
-
254
-
255
-
256
-
257
-
258
-
259
-
260
-
261
-
262
-
263
-
264
-
265
-
266
 |
 |