HP StorageWorks 2/16V Brocade Web Tools Administrator's Guide - Supporting Fab - Page 154
Creating AL_PA Error Graphs, Managing performance graphs, Saving graphs to a canvas
 |
View all HP StorageWorks 2/16V manuals
Add to My Manuals
Save this manual to your list of manuals |
Page 154 highlights
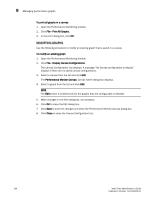
9 Managing performance graphs 4. Click the port from the Slot/Port Selection List and drag it into the Enter/drag slot,port field. 5. Optional: For the LUN per port graphs, type a LUN number, in hexadecimal notation. For the Brocade 4100 or 5000 switch, you can enter up to eight LUN masks. For the Brocade 48000 director, you can enter up to four LUN masks. For all other switches running Fabric OS 4.x or v5.x, you can enter up to two LUN masks. For switches running Fabric OS 3.x, you can enter up to three LUN masks. 6. Click OK. The selected graph is displayed in the canvas. CREATING AL_PA ERROR GRAPHS The AL_PA Error graph displays CRC errors for a given port and a given AL_PA. The AL_PA Error graph is not supported on the following: • Brocade 200E, 4012, 4016, 4018, 4020, 4024, 4100, 4900, 5000, 7500, and 7600 • Brocade 48000 with an FR4-18i, FC4-16IP, FC-18 or FC4-48 blade(s) installed To create an AL_PA error graph 1. Open the Performance Monitoring window. 2. Click Performance Graphs> Advanced Monitoring> ALPA Error. The ALPA Error Setup dialog box opens. 3. Navigate to a switch> slot> port in the Slot/Port or Alpa Selection List. 4. Click the port from the Slot/Port Selection List or an AL_PA from the Slot/Port Selection List, and drag it into the "Enter/drag slot,port" field. You can also manually type the slot and port number, in the format slot,port. 5. Click OK. The AL_PA Error graph opens on the canvas. Managing performance graphs This section provides the following procedures for managing performance graphs: • Saving graphs to a canvas 132 • Adding graphs to a canvas 133 • Printing graphs 133 • Modifying graphs 134 SAVING GRAPHS TO A CANVAS Saving graphs is especially useful when you create customized graphs and do not want to re-create them every time you access the Performance Monitoring window. When you save graphs, you must save them to a canvas. The following procedure describes how to save graphs to a new canvas. 132 Web Tools Administrator's Guide Publication Number: 53-1000435-01
-
 1
1 -
2
-
3
-
4
-
5
-
6
-
7
-
8
-
9
-
10
-
11
-
12
-
13
-
14
-
15
-
16
-
17
-
18
-
19
-
20
-
21
-
22
-
23
-
24
-
25
-
26
-
27
-
28
-
29
-
30
-
31
-
32
-
33
-
34
-
35
-
36
-
37
-
38
-
39
-
40
-
41
-
42
-
43
-
44
-
45
-
46
-
47
-
48
-
49
-
50
-
51
-
52
-
53
-
54
-
55
-
56
-
57
-
58
-
59
-
60
-
61
-
62
-
63
-
64
-
65
-
66
-
67
-
68
-
69
-
70
-
71
-
72
-
73
-
74
-
75
-
76
-
77
-
78
-
79
-
80
-
81
-
82
-
83
-
84
-
85
-
86
-
87
-
88
-
89
-
90
-
91
-
92
-
93
-
94
-
95
-
96
-
97
-
98
-
99
-
100
-
101
-
102
-
103
-
104
-
105
-
106
-
107
-
108
-
109
-
110
-
111
-
112
-
113
-
114
-
115
-
116
-
117
-
118
-
119
-
120
-
121
-
122
-
123
-
124
-
125
-
126
-
127
-
128
-
129
-
130
-
131
-
132
-
133
-
134
-
135
-
136
-
137
-
138
-
139
-
140
-
141
-
142
-
143
-
144
-
145
-
146
-
147
-
148
-
 149
149 -
 150
150 -
 151
151 -
 152
152 -
 153
153 -
 154
154 -
 155
155 -
 156
156 -
 157
157 -
 158
158 -
 159
159 -
160
-
161
-
162
-
163
-
164
-
165
-
166
-
167
-
168
-
169
-
170
-
171
-
172
-
173
-
174
-
175
-
176
-
177
-
178
-
179
-
180
-
181
-
182
-
183
-
184
-
185
-
186
-
187
-
188
-
189
-
190
-
191
-
192
-
193
-
194
-
195
-
196
-
197
-
198
-
199
-
200
-
201
-
202
-
203
-
204
-
205
-
206
-
207
-
208
-
209
-
210
-
211
-
212
-
213
-
214
-
215
-
216
-
217
-
218
-
219
-
220
-
221
-
222
-
223
-
224
-
225
-
226
-
227
-
228
-
229
-
230
-
231
-
232
-
233
-
234
-
235
-
236
-
237
-
238
-
239
-
240
-
241
-
242
-
243
-
244
-
245
-
246
-
247
-
248
-
249
-
250
-
251
-
252
-
253
-
254
-
255
-
256
-
257
-
258
-
259
-
260
-
261
-
262
-
263
-
264
-
265
-
266
 |
 |