HP StorageWorks 2/16V Brocade Web Tools Administrator's Guide - Supporting Fab - Page 73
Filtering Fabric and Switch Events, Displaying Fabric, Events, Displaying Switch Events
 |
View all HP StorageWorks 2/16V manuals
Add to My Manuals
Save this manual to your list of manuals |
Page 73 highlights
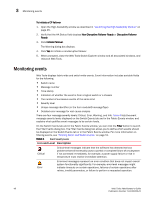
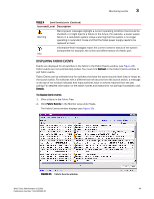
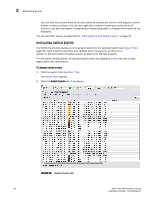
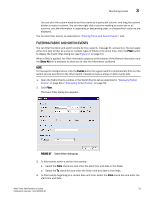
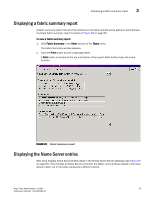
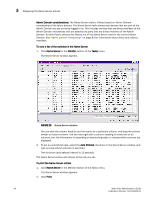
Monitoring events 3 You can click the column head to sort the events by a particular column, and drag the column divider to resize a column. You can also right-click a column heading to resize one or all columns, sort the information in ascending or descending order, or choose which columns are displayed. You can also filter events, as described in "Filtering Fabric and Switch Events," next. FILTERING FABRIC AND SWITCH EVENTS You can filter the fabric and switch events by time, severity, message ID, and service. You can apply either one type of filter at a time or multiple types of filters at the same time. Click the Filter button to display the Event Filter dialog box (see Figure 27 on page 51). When a filter is applied, the filter information appears at the bottom of the filtered information and the Show All link is available to allow you to view the information unfiltered. NOTE For two-switch configurations, click the Events button for a given switch to automatically filter out the switch service events from the other switch. Chassis service is shown in both events lists. 1. Open the Fabric Events window or the Switch Events tab as described in "Displaying Fabric Events" on page 49 or "Displaying Switch Events" on page 50. 2. Click Filter. The Event Filter dialog box appears. FIGURE 27 Event Filter dialog box 3. To filter events within a certain time period: a. Select the From check box and enter the start time and date in the fields. b. Select the To check box and enter the finish time and date in the fields. 4. To filter events beginning at a certain date and time, select the From check box and enter the start time and date. Web Tools Administrator's Guide 51 Publication Number: 53-1000435-01
-
 1
1 -
2
-
3
-
4
-
5
-
6
-
7
-
8
-
9
-
10
-
11
-
12
-
13
-
14
-
15
-
16
-
17
-
18
-
19
-
20
-
21
-
22
-
23
-
24
-
25
-
26
-
27
-
28
-
29
-
30
-
31
-
32
-
33
-
34
-
35
-
36
-
37
-
38
-
39
-
40
-
41
-
42
-
43
-
44
-
45
-
46
-
47
-
48
-
49
-
50
-
51
-
52
-
53
-
54
-
55
-
56
-
57
-
58
-
59
-
60
-
61
-
62
-
63
-
64
-
65
-
66
-
67
-
 68
68 -
 69
69 -
 70
70 -
 71
71 -
 72
72 -
 73
73 -
 74
74 -
 75
75 -
 76
76 -
 77
77 -
 78
78 -
79
-
80
-
81
-
82
-
83
-
84
-
85
-
86
-
87
-
88
-
89
-
90
-
91
-
92
-
93
-
94
-
95
-
96
-
97
-
98
-
99
-
100
-
101
-
102
-
103
-
104
-
105
-
106
-
107
-
108
-
109
-
110
-
111
-
112
-
113
-
114
-
115
-
116
-
117
-
118
-
119
-
120
-
121
-
122
-
123
-
124
-
125
-
126
-
127
-
128
-
129
-
130
-
131
-
132
-
133
-
134
-
135
-
136
-
137
-
138
-
139
-
140
-
141
-
142
-
143
-
144
-
145
-
146
-
147
-
148
-
149
-
150
-
151
-
152
-
153
-
154
-
155
-
156
-
157
-
158
-
159
-
160
-
161
-
162
-
163
-
164
-
165
-
166
-
167
-
168
-
169
-
170
-
171
-
172
-
173
-
174
-
175
-
176
-
177
-
178
-
179
-
180
-
181
-
182
-
183
-
184
-
185
-
186
-
187
-
188
-
189
-
190
-
191
-
192
-
193
-
194
-
195
-
196
-
197
-
198
-
199
-
200
-
201
-
202
-
203
-
204
-
205
-
206
-
207
-
208
-
209
-
210
-
211
-
212
-
213
-
214
-
215
-
216
-
217
-
218
-
219
-
220
-
221
-
222
-
223
-
224
-
225
-
226
-
227
-
228
-
229
-
230
-
231
-
232
-
233
-
234
-
235
-
236
-
237
-
238
-
239
-
240
-
241
-
242
-
243
-
244
-
245
-
246
-
247
-
248
-
249
-
250
-
251
-
252
-
253
-
254
-
255
-
256
-
257
-
258
-
259
-
260
-
261
-
262
-
263
-
264
-
265
-
266
 |
 |