HP StorageWorks 2/16V Brocade Web Tools Administrator's Guide - Supporting Fab - Page 152
Creating an SCSI vs. IP Traffic Graph, Click a port from the Slot/Port or Sid/Did Selection List.
 |
View all HP StorageWorks 2/16V manuals
Add to My Manuals
Save this manual to your list of manuals |
Page 152 highlights
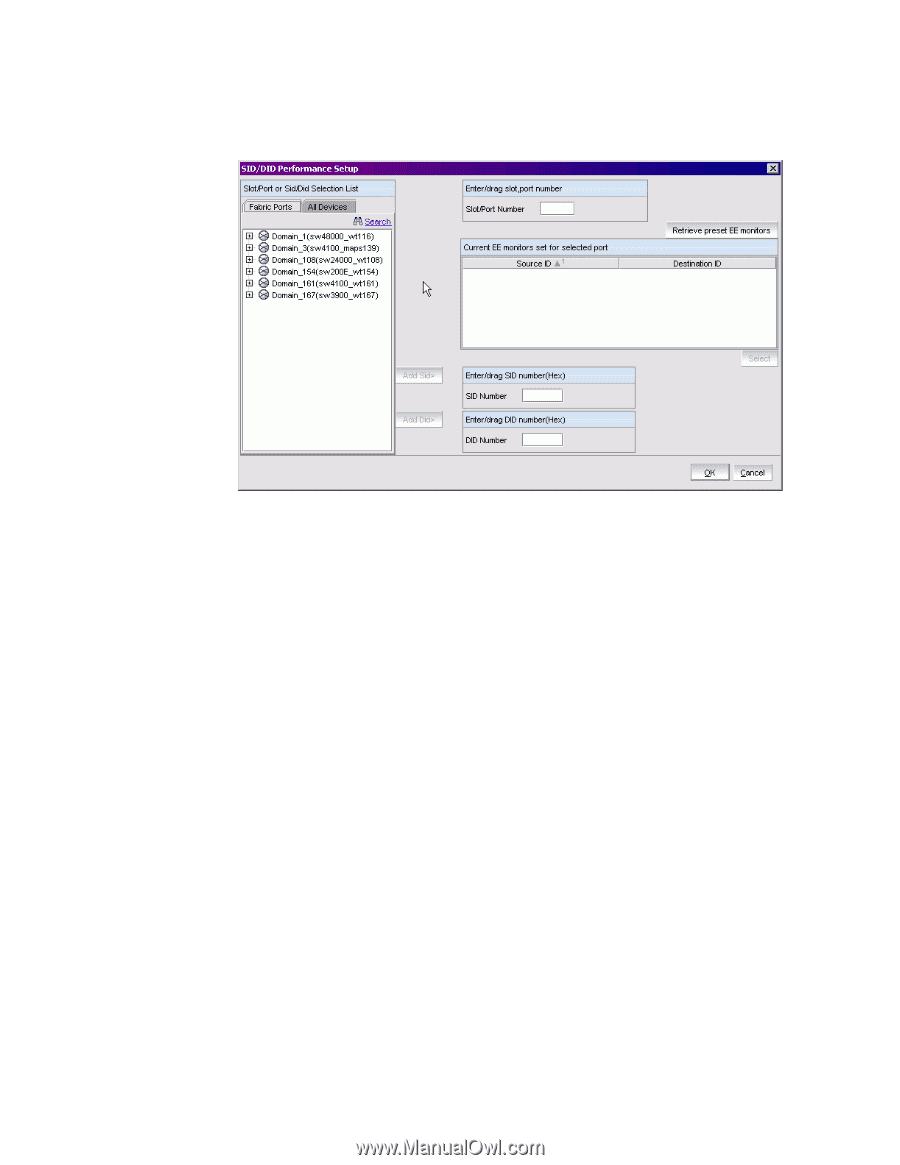
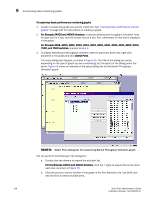
9 Creating advanced performance monitoring graphs - To specify the port, Source ID and Domain ID, skip to step 4. FIGURE 56 Creating an SID/DID performance graph 3. Click a port from the Slot/Port or Sid/Did Selection List. a. Drag the selected port into the Enter/drag port number field. b. Click Retrieve preset EE monitors. The current end-to-end monitors for that port are displayed in the "Current EE monitors set for selected port" table. c. Optional: To display a performance graph for the current EE monitors set for the selected port, click a SID-DID pair in the table. You can select multiple source ID and Destination IDs. Click Select. If you selected multiple SID/DID monitors, click OK in the confirmation dialog box that appears. Skip to step 6. If you do not want to display a performance graph for the current EE monitors set for the selected port, continue with step 4. 4. Click a source ID from the "Port or Sid/Did Selection List," and click Add Sid. You can also type a source ID in the "Enter/drag SID number" field. 5. Click a destination ID from the "Port or Sid/Did Selection List," and click Add Did. You can also type a destination ID in the "Enter/drag DID number" field. 6. Click OK. If you selected multiple EE monitors, SIDs, or PIDs, a confirmation dialog box displays, reminding you that one graph will be opened for each selection. Click Yes to display the graphs. CREATING AN SCSI VS. IP TRAFFIC GRAPH The SCSI vs. IP Traffic graph displays the SCSI versus IP traffic for selected ports. For Brocade 24000 and 48000 directors, the slot and port name is identified in the graph. In a trunk group, the SCSI vs. IP Traffic graph displays only the master port and not the slave ports. 130 Web Tools Administrator's Guide Publication Number: 53-1000435-01
-
 1
1 -
2
-
3
-
4
-
5
-
6
-
7
-
8
-
9
-
10
-
11
-
12
-
13
-
14
-
15
-
16
-
17
-
18
-
19
-
20
-
21
-
22
-
23
-
24
-
25
-
26
-
27
-
28
-
29
-
30
-
31
-
32
-
33
-
34
-
35
-
36
-
37
-
38
-
39
-
40
-
41
-
42
-
43
-
44
-
45
-
46
-
47
-
48
-
49
-
50
-
51
-
52
-
53
-
54
-
55
-
56
-
57
-
58
-
59
-
60
-
61
-
62
-
63
-
64
-
65
-
66
-
67
-
68
-
69
-
70
-
71
-
72
-
73
-
74
-
75
-
76
-
77
-
78
-
79
-
80
-
81
-
82
-
83
-
84
-
85
-
86
-
87
-
88
-
89
-
90
-
91
-
92
-
93
-
94
-
95
-
96
-
97
-
98
-
99
-
100
-
101
-
102
-
103
-
104
-
105
-
106
-
107
-
108
-
109
-
110
-
111
-
112
-
113
-
114
-
115
-
116
-
117
-
118
-
119
-
120
-
121
-
122
-
123
-
124
-
125
-
126
-
127
-
128
-
129
-
130
-
131
-
132
-
133
-
134
-
135
-
136
-
137
-
138
-
139
-
140
-
141
-
142
-
143
-
144
-
145
-
146
-
 147
147 -
 148
148 -
 149
149 -
 150
150 -
 151
151 -
 152
152 -
 153
153 -
 154
154 -
 155
155 -
 156
156 -
 157
157 -
158
-
159
-
160
-
161
-
162
-
163
-
164
-
165
-
166
-
167
-
168
-
169
-
170
-
171
-
172
-
173
-
174
-
175
-
176
-
177
-
178
-
179
-
180
-
181
-
182
-
183
-
184
-
185
-
186
-
187
-
188
-
189
-
190
-
191
-
192
-
193
-
194
-
195
-
196
-
197
-
198
-
199
-
200
-
201
-
202
-
203
-
204
-
205
-
206
-
207
-
208
-
209
-
210
-
211
-
212
-
213
-
214
-
215
-
216
-
217
-
218
-
219
-
220
-
221
-
222
-
223
-
224
-
225
-
226
-
227
-
228
-
229
-
230
-
231
-
232
-
233
-
234
-
235
-
236
-
237
-
238
-
239
-
240
-
241
-
242
-
243
-
244
-
245
-
246
-
247
-
248
-
249
-
250
-
251
-
252
-
253
-
254
-
255
-
256
-
257
-
258
-
259
-
260
-
261
-
262
-
263
-
264
-
265
-
266
 |
 |