HP StorageWorks 2/16V Brocade Web Tools Administrator's Guide - Supporting Fab - Page 151
Creating advanced performance monitoring graphs, Creating SID-DID Performance Graphs
 |
View all HP StorageWorks 2/16V manuals
Add to My Manuals
Save this manual to your list of manuals |
Page 151 highlights
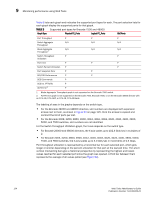
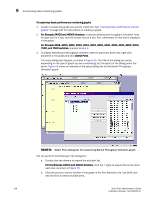
Creating advanced performance monitoring graphs 9 c. Click Add to move the selected ports to the Selected Ports list. d. Optional: Click ADD ALL Ports to add all of the ports in the Port Selection List to the Selected Ports list. e. Optional: Click Search to open the Search Port Selection List dialog box, from which you can search for all E_Ports, all F_Ports, or all port names with a defined string. Select the ports you want to add and click Search in the Search Port Selection List dialog box. f. Click Apply. Only the selected ports are displayed in the graph. Creating advanced performance monitoring graphs This section describes how to create the advanced performance monitor graphs listed in Table 7 on page 123. Because the procedure for creating these graphs differs depending on the type of graph, each type is described separately in the sections that follow. The advanced monitoring graphs are not supported for GbE ports. NOTE You must have an Advanced Performance Monitoring license installed to use the Advance Performance Monitor features. If user-defined Admin Domains have been configured, Advanced Performance Monitoring works only in AD255. CREATING SID-DID PERFORMANCE GRAPHS The SID/DID Performance graph displays the traffic between a SID-DID pair on the switch being managed. To create an SID/DID performance graph 1. Open the Performance Monitoring window. 2. Click Performance Graphs> Advanced Monitoring> SID/DID Performance. The SID/DID Performance Setup dialog box displays (see Figure 56 on page 130). - To see which end-to-end (EE) monitors are currently set up on a particular port, proceed to step 3. Web Tools Administrator's Guide 129 Publication Number: 53-1000435-01
-
 1
1 -
2
-
3
-
4
-
5
-
6
-
7
-
8
-
9
-
10
-
11
-
12
-
13
-
14
-
15
-
16
-
17
-
18
-
19
-
20
-
21
-
22
-
23
-
24
-
25
-
26
-
27
-
28
-
29
-
30
-
31
-
32
-
33
-
34
-
35
-
36
-
37
-
38
-
39
-
40
-
41
-
42
-
43
-
44
-
45
-
46
-
47
-
48
-
49
-
50
-
51
-
52
-
53
-
54
-
55
-
56
-
57
-
58
-
59
-
60
-
61
-
62
-
63
-
64
-
65
-
66
-
67
-
68
-
69
-
70
-
71
-
72
-
73
-
74
-
75
-
76
-
77
-
78
-
79
-
80
-
81
-
82
-
83
-
84
-
85
-
86
-
87
-
88
-
89
-
90
-
91
-
92
-
93
-
94
-
95
-
96
-
97
-
98
-
99
-
100
-
101
-
102
-
103
-
104
-
105
-
106
-
107
-
108
-
109
-
110
-
111
-
112
-
113
-
114
-
115
-
116
-
117
-
118
-
119
-
120
-
121
-
122
-
123
-
124
-
125
-
126
-
127
-
128
-
129
-
130
-
131
-
132
-
133
-
134
-
135
-
136
-
137
-
138
-
139
-
140
-
141
-
142
-
143
-
144
-
145
-
 146
146 -
 147
147 -
 148
148 -
 149
149 -
 150
150 -
 151
151 -
 152
152 -
 153
153 -
 154
154 -
 155
155 -
 156
156 -
157
-
158
-
159
-
160
-
161
-
162
-
163
-
164
-
165
-
166
-
167
-
168
-
169
-
170
-
171
-
172
-
173
-
174
-
175
-
176
-
177
-
178
-
179
-
180
-
181
-
182
-
183
-
184
-
185
-
186
-
187
-
188
-
189
-
190
-
191
-
192
-
193
-
194
-
195
-
196
-
197
-
198
-
199
-
200
-
201
-
202
-
203
-
204
-
205
-
206
-
207
-
208
-
209
-
210
-
211
-
212
-
213
-
214
-
215
-
216
-
217
-
218
-
219
-
220
-
221
-
222
-
223
-
224
-
225
-
226
-
227
-
228
-
229
-
230
-
231
-
232
-
233
-
234
-
235
-
236
-
237
-
238
-
239
-
240
-
241
-
242
-
243
-
244
-
245
-
246
-
247
-
248
-
249
-
250
-
251
-
252
-
253
-
254
-
255
-
256
-
257
-
258
-
259
-
260
-
261
-
262
-
263
-
264
-
265
-
266
 |
 |