HP StorageWorks 2/16V Brocade Web Tools Administrator's Guide - Supporting Fab - Page 149
Creating basic performance monitor graphs, Customizing basic monitoring graphs
 |
View all HP StorageWorks 2/16V manuals
Add to My Manuals
Save this manual to your list of manuals |
Page 149 highlights
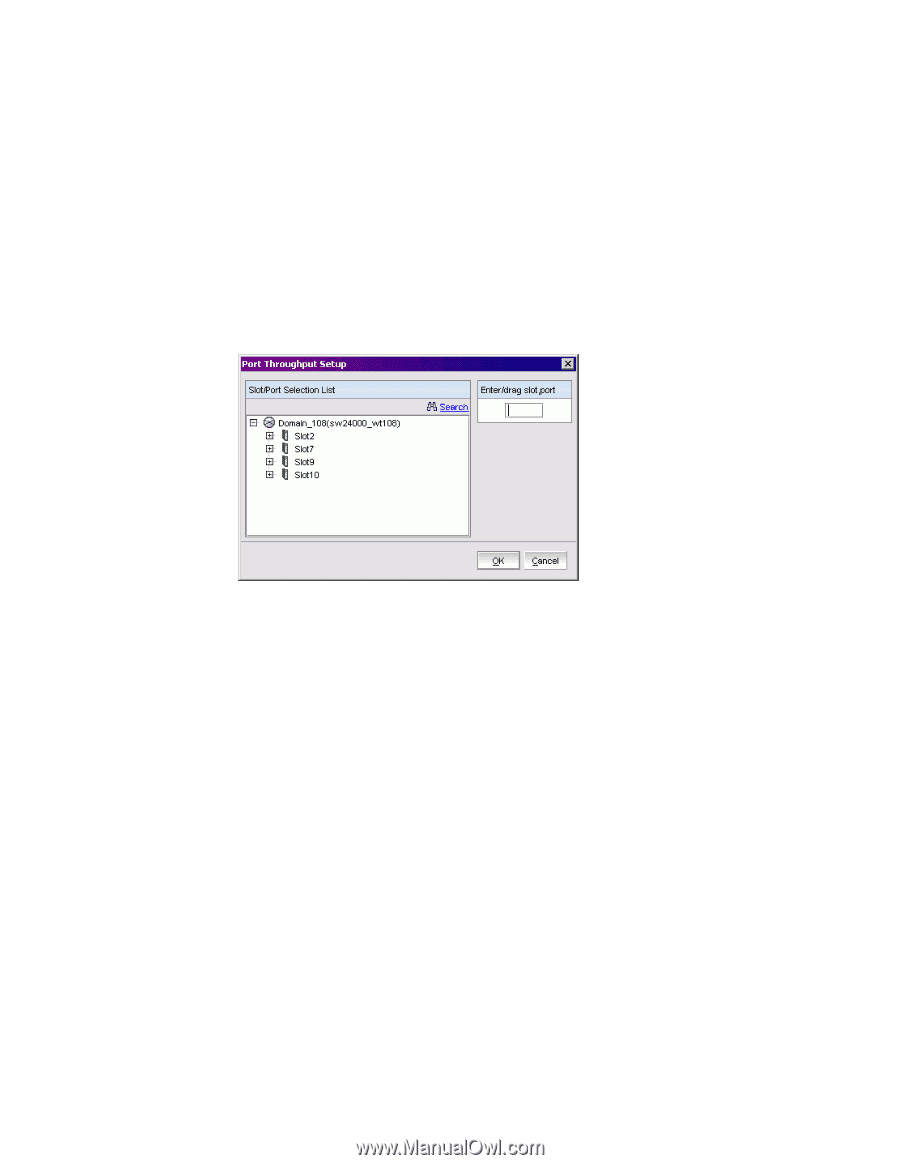
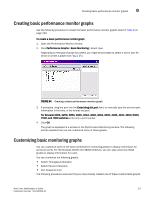
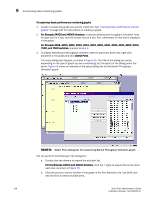
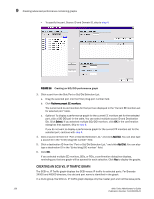
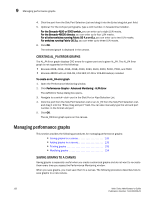
Creating basic performance monitor graphs 9 Creating basic performance monitor graphs Use the following procedure to create the basic performance monitor graphs listed in Table 6 on page 123. To create a basic performance monitor graph 1. Open the Performance Monitor window. 2. Click Performance Graphs> Basic Monitoring> Graph Type. Depending on the type of graph you select, you might be prompted to select a slot or port for which to create a graph (see Figure 55). FIGURE 54 Creating a basic performance monitor graph 3. If prompted, drag the port into the Enter/drag slot,port field, or manually type the slot and port information in the field, in the format slot,port. For Brocade 200E, 3250, 3850, 3900, 4012, 4016, 4018, 4020, 4024, 4100, 4900, 5000, 7500, and 7600 switches enter only a port number. 4. Click OK. The graph is displayed in a window in the Performance Monitoring window. The following section explains how you can customize some of these graphs. Customizing basic monitoring graphs You can customize some of the basic performance monitoring graphs to display information for particular ports. For the Brocade 24000 and 48000 directors, you can also customize these graphs to display information for a slot. You can customize the following graphs: • Switch Throughput Utilization • Switch Percent Utilization • Port Snapshot Error The following procedure assumes that you have already created one of these customizable graphs. Web Tools Administrator's Guide 127 Publication Number: 53-1000435-01
-
 1
1 -
2
-
3
-
4
-
5
-
6
-
7
-
8
-
9
-
10
-
11
-
12
-
13
-
14
-
15
-
16
-
17
-
18
-
19
-
20
-
21
-
22
-
23
-
24
-
25
-
26
-
27
-
28
-
29
-
30
-
31
-
32
-
33
-
34
-
35
-
36
-
37
-
38
-
39
-
40
-
41
-
42
-
43
-
44
-
45
-
46
-
47
-
48
-
49
-
50
-
51
-
52
-
53
-
54
-
55
-
56
-
57
-
58
-
59
-
60
-
61
-
62
-
63
-
64
-
65
-
66
-
67
-
68
-
69
-
70
-
71
-
72
-
73
-
74
-
75
-
76
-
77
-
78
-
79
-
80
-
81
-
82
-
83
-
84
-
85
-
86
-
87
-
88
-
89
-
90
-
91
-
92
-
93
-
94
-
95
-
96
-
97
-
98
-
99
-
100
-
101
-
102
-
103
-
104
-
105
-
106
-
107
-
108
-
109
-
110
-
111
-
112
-
113
-
114
-
115
-
116
-
117
-
118
-
119
-
120
-
121
-
122
-
123
-
124
-
125
-
126
-
127
-
128
-
129
-
130
-
131
-
132
-
133
-
134
-
135
-
136
-
137
-
138
-
139
-
140
-
141
-
142
-
143
-
 144
144 -
 145
145 -
 146
146 -
 147
147 -
 148
148 -
 149
149 -
 150
150 -
 151
151 -
 152
152 -
 153
153 -
 154
154 -
155
-
156
-
157
-
158
-
159
-
160
-
161
-
162
-
163
-
164
-
165
-
166
-
167
-
168
-
169
-
170
-
171
-
172
-
173
-
174
-
175
-
176
-
177
-
178
-
179
-
180
-
181
-
182
-
183
-
184
-
185
-
186
-
187
-
188
-
189
-
190
-
191
-
192
-
193
-
194
-
195
-
196
-
197
-
198
-
199
-
200
-
201
-
202
-
203
-
204
-
205
-
206
-
207
-
208
-
209
-
210
-
211
-
212
-
213
-
214
-
215
-
216
-
217
-
218
-
219
-
220
-
221
-
222
-
223
-
224
-
225
-
226
-
227
-
228
-
229
-
230
-
231
-
232
-
233
-
234
-
235
-
236
-
237
-
238
-
239
-
240
-
241
-
242
-
243
-
244
-
245
-
246
-
247
-
248
-
249
-
250
-
251
-
252
-
253
-
254
-
255
-
256
-
257
-
258
-
259
-
260
-
261
-
262
-
263
-
264
-
265
-
266
 |
 |