HP StorageWorks 2/16V Brocade Web Tools Administrator's Guide - Supporting Fab - Page 144
Predefined performance graphs, Window> Tile, Window> Cascade, Window
 |
View all HP StorageWorks 2/16V manuals
Add to My Manuals
Save this manual to your list of manuals |
Page 144 highlights
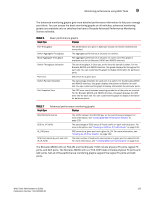
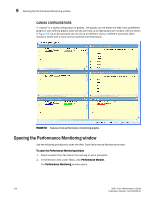
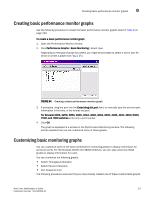
9 Monitoring performance using Web Tools Graphs within the Performance Monitoring window are updated every 30 seconds. When you first display the graph or if you modify the graph (such as to add additional ports), you might have to wait up to 30 seconds before the new values are shown. When you have multiple graphs open in the Performance Monitoring window, you can: • Click Window> Tile to view all graphs at once, tiled in the Performance Monitoring window. • Select Window> Cascade to view one graph at a time. • Select Window> Close All to close all open Performance Monitor graphs in the Performance Monitoring window. In addition, the Window menu lists all open graphs. You can click Window, and then select a graph name to view that graph. Admin Domain considerations: • If you are not the switch owner, you will see the following ports: - E_ports, including EX_Ports - directly owned ports - indirect ports • You can use the Advanced Performance Monitoring feature only in AD255 or in AD0 if there are no other user-defined Admin Domains. Otherwise, access to Advanced Monitoring features in the Performance Graphs menu will be unavailable. • It is recommended that you define a user with a switchadmin role and give that user access to AD255 for the purpose of data collecting using the Advanced Performance Monitor. PREDEFINED PERFORMANCE GRAPHS Web Tools predefines basic graph types, to simplify performance monitoring. A wide range of end-to-end fabric, LUN, device, and port metrics graphs are included. Table 6 lists the basic monitoring graphs available. Table 7 on page 123 lists the advanced monitoring graphs. 122 Web Tools Administrator's Guide Publication Number: 53-1000435-01
-
 1
1 -
2
-
3
-
4
-
5
-
6
-
7
-
8
-
9
-
10
-
11
-
12
-
13
-
14
-
15
-
16
-
17
-
18
-
19
-
20
-
21
-
22
-
23
-
24
-
25
-
26
-
27
-
28
-
29
-
30
-
31
-
32
-
33
-
34
-
35
-
36
-
37
-
38
-
39
-
40
-
41
-
42
-
43
-
44
-
45
-
46
-
47
-
48
-
49
-
50
-
51
-
52
-
53
-
54
-
55
-
56
-
57
-
58
-
59
-
60
-
61
-
62
-
63
-
64
-
65
-
66
-
67
-
68
-
69
-
70
-
71
-
72
-
73
-
74
-
75
-
76
-
77
-
78
-
79
-
80
-
81
-
82
-
83
-
84
-
85
-
86
-
87
-
88
-
89
-
90
-
91
-
92
-
93
-
94
-
95
-
96
-
97
-
98
-
99
-
100
-
101
-
102
-
103
-
104
-
105
-
106
-
107
-
108
-
109
-
110
-
111
-
112
-
113
-
114
-
115
-
116
-
117
-
118
-
119
-
120
-
121
-
122
-
123
-
124
-
125
-
126
-
127
-
128
-
129
-
130
-
131
-
132
-
133
-
134
-
135
-
136
-
137
-
138
-
 139
139 -
 140
140 -
 141
141 -
 142
142 -
 143
143 -
 144
144 -
 145
145 -
 146
146 -
 147
147 -
 148
148 -
 149
149 -
150
-
151
-
152
-
153
-
154
-
155
-
156
-
157
-
158
-
159
-
160
-
161
-
162
-
163
-
164
-
165
-
166
-
167
-
168
-
169
-
170
-
171
-
172
-
173
-
174
-
175
-
176
-
177
-
178
-
179
-
180
-
181
-
182
-
183
-
184
-
185
-
186
-
187
-
188
-
189
-
190
-
191
-
192
-
193
-
194
-
195
-
196
-
197
-
198
-
199
-
200
-
201
-
202
-
203
-
204
-
205
-
206
-
207
-
208
-
209
-
210
-
211
-
212
-
213
-
214
-
215
-
216
-
217
-
218
-
219
-
220
-
221
-
222
-
223
-
224
-
225
-
226
-
227
-
228
-
229
-
230
-
231
-
232
-
233
-
234
-
235
-
236
-
237
-
238
-
239
-
240
-
241
-
242
-
243
-
244
-
245
-
246
-
247
-
248
-
249
-
250
-
251
-
252
-
253
-
254
-
255
-
256
-
257
-
258
-
259
-
260
-
261
-
262
-
263
-
264
-
265
-
266
 |
 |