HP StorageWorks 2/16V Brocade Web Tools Administrator's Guide - Supporting Fab - Page 46
Refresh rates, Displaying switches in the fabric
 |
View all HP StorageWorks 2/16V manuals
Add to My Manuals
Save this manual to your list of manuals |
Page 46 highlights
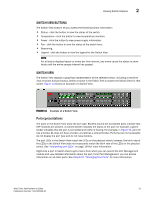
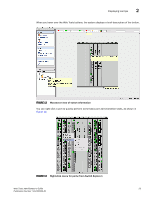
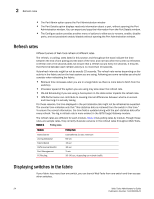
2 Refresh rates • The Port Admin option opens the Port Administration window • The Port Details option displays read-only information about a port, without opening the Port Administration window. You can export and copy the information from the Port Details window. • The Configure option provides another menu of options to allow you to rename, enable, disable ports, and set persistent enable/disable without opening the Port Administration window. Refresh rates Different panels of Web Tools refresh at different rates. The refresh, or polling, rates listed in this section and throughout the book indicate the time between the end of one polling and the start of the next, and not how often the screen is refreshed. A refresh rate of 15 seconds does not ensure that a refresh occurs every 15 seconds. It ensures that the time between each refresh activity is no more than 15 seconds. Autorefresh intervals might be not be exactly 15 seconds. The refresh rate varies depending on the activity in the fabric and on the host system you are using. Following are some variables you should consider when refreshing the fabric: • Retrieval time increases when you are in a large fabric as there is more data to fetch from the switch(s). • Processor speed of the system you are using may slow down the refresh rate. • OS-Job Scheduling if you are using a host-system in the data center impacts the refresh rate. • JVM-Performance can contribute to causing interval differences between what is on-screen and how long it is actually taking. For these reasons, the time displayed in the port statistics tab might not be refreshed as expected. The counter time indicates only that "this statistics data is retrieved from the switch in this time." To ensure the correct information, the time field is updated along with the port statistics data after every refresh. The lag in refresh rate is more evident in the iSCSI Target Gateway module. The refresh rates are different for each module. Table 3 lists polling rates by module. Though these rates are sample rates, they correctly illustrate variance in the refresh rates throughout Web Tools. TABLE 3 Polling rates Module Polling Rate Name Server Zoning Database Fabric Watch Performance Monitor Port Management FC Routing User-defined; 15 sec minimum 60 sec 15 sec 30 sec 2 min 30-90 sec, depending on network traffic Displaying switches in the fabric If your fabric has more than one switch, you can launch Web Tools from one switch and then access other switches. 24 Web Tools Administrator's Guide Publication Number: 53-1000435-01
-
 1
1 -
2
-
3
-
4
-
5
-
6
-
7
-
8
-
9
-
10
-
11
-
12
-
13
-
14
-
15
-
16
-
17
-
18
-
19
-
20
-
21
-
22
-
23
-
24
-
25
-
26
-
27
-
28
-
29
-
30
-
31
-
32
-
33
-
34
-
35
-
36
-
37
-
38
-
39
-
40
-
 41
41 -
 42
42 -
 43
43 -
 44
44 -
 45
45 -
 46
46 -
 47
47 -
 48
48 -
 49
49 -
 50
50 -
 51
51 -
52
-
53
-
54
-
55
-
56
-
57
-
58
-
59
-
60
-
61
-
62
-
63
-
64
-
65
-
66
-
67
-
68
-
69
-
70
-
71
-
72
-
73
-
74
-
75
-
76
-
77
-
78
-
79
-
80
-
81
-
82
-
83
-
84
-
85
-
86
-
87
-
88
-
89
-
90
-
91
-
92
-
93
-
94
-
95
-
96
-
97
-
98
-
99
-
100
-
101
-
102
-
103
-
104
-
105
-
106
-
107
-
108
-
109
-
110
-
111
-
112
-
113
-
114
-
115
-
116
-
117
-
118
-
119
-
120
-
121
-
122
-
123
-
124
-
125
-
126
-
127
-
128
-
129
-
130
-
131
-
132
-
133
-
134
-
135
-
136
-
137
-
138
-
139
-
140
-
141
-
142
-
143
-
144
-
145
-
146
-
147
-
148
-
149
-
150
-
151
-
152
-
153
-
154
-
155
-
156
-
157
-
158
-
159
-
160
-
161
-
162
-
163
-
164
-
165
-
166
-
167
-
168
-
169
-
170
-
171
-
172
-
173
-
174
-
175
-
176
-
177
-
178
-
179
-
180
-
181
-
182
-
183
-
184
-
185
-
186
-
187
-
188
-
189
-
190
-
191
-
192
-
193
-
194
-
195
-
196
-
197
-
198
-
199
-
200
-
201
-
202
-
203
-
204
-
205
-
206
-
207
-
208
-
209
-
210
-
211
-
212
-
213
-
214
-
215
-
216
-
217
-
218
-
219
-
220
-
221
-
222
-
223
-
224
-
225
-
226
-
227
-
228
-
229
-
230
-
231
-
232
-
233
-
234
-
235
-
236
-
237
-
238
-
239
-
240
-
241
-
242
-
243
-
244
-
245
-
246
-
247
-
248
-
249
-
250
-
251
-
252
-
253
-
254
-
255
-
256
-
257
-
258
-
259
-
260
-
261
-
262
-
263
-
264
-
265
-
266
 |
 |