HP StorageWorks 2/16V Brocade Web Tools Administrator's Guide - Supporting Fab - Page 74

Displaying Fabric, Events, Displaying Switch Events, Message ID

Page 74 highlights

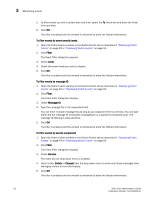
3 Monitoring events 5. To filter events up until a certain date and time, select the To check box and enter the finish time and date. 6. Click OK. The filter is enabled and the window is refreshed to show the filtered information. To filter events by event severity levels 1. Open the Fabric Events window or the Switch Events tab as described in "Displaying Fabric Events" on page 49 or "Displaying Switch Events" on page 50. 2. Click Filter. The Event Filter dialog box appears. 3. Check Level. 4. Check the event levels you want to display. 5. Click OK. The filter is enabled and the window is refreshed to show the filtered information. To filter events by message ID 1. Open the Fabric Events window or the Switch Events tab as described in "Displaying Fabric Events" on page 49 or "Displaying Switch Events" on page 50. 2. Click Filter. The Event Filter dialog box displays. 3. Check Message ID. 4. Type the message IDs in the associated field. You can enter multiple message IDs as long as you separate them by commas. You can type either the full message ID (moduleID-messageType) or a partial ID (moduleID only). The message ID filtering is case-sensitive. 5. Click OK. The filter is enabled and the window is refreshed to show the filtered information. To filter events by service component 1. Open the Fabric Events window or the Switch Events tab as described in "Displaying Fabric Events" on page 49 or "Displaying Switch Events" on page 50. 2. Click Filter. The Event Filter dialog box displays. 3. Check Service. The event service drop-down menu is enabled. 4. Select either Switch or Chassis from the drop-down menu to show only those messages from the logical switch or from the chassis. 5. Click OK. The filter is enabled and the window is refreshed to show the filtered information. 52 Web Tools Administrator's Guide Publication Number: 53-1000435-01

  • 1
  • 2
  • 3
  • 4
  • 5
  • 6
  • 7
  • 8
  • 9
  • 10
  • 11
  • 12
  • 13
  • 14
  • 15
  • 16
  • 17
  • 18
  • 19
  • 20
  • 21
  • 22
  • 23
  • 24
  • 25
  • 26
  • 27
  • 28
  • 29
  • 30
  • 31
  • 32
  • 33
  • 34
  • 35
  • 36
  • 37
  • 38
  • 39
  • 40
  • 41
  • 42
  • 43
  • 44
  • 45
  • 46
  • 47
  • 48
  • 49
  • 50
  • 51
  • 52
  • 53
  • 54
  • 55
  • 56
  • 57
  • 58
  • 59
  • 60
  • 61
  • 62
  • 63
  • 64
  • 65
  • 66
  • 67
  • 68
  • 69
  • 70
  • 71
  • 72
  • 73
  • 74
  • 75
  • 76
  • 77
  • 78
  • 79
  • 80
  • 81
  • 82
  • 83
  • 84
  • 85
  • 86
  • 87
  • 88
  • 89
  • 90
  • 91
  • 92
  • 93
  • 94
  • 95
  • 96
  • 97
  • 98
  • 99
  • 100
  • 101
  • 102
  • 103
  • 104
  • 105
  • 106
  • 107
  • 108
  • 109
  • 110
  • 111
  • 112
  • 113
  • 114
  • 115
  • 116
  • 117
  • 118
  • 119
  • 120
  • 121
  • 122
  • 123
  • 124
  • 125
  • 126
  • 127
  • 128
  • 129
  • 130
  • 131
  • 132
  • 133
  • 134
  • 135
  • 136
  • 137
  • 138
  • 139
  • 140
  • 141
  • 142
  • 143
  • 144
  • 145
  • 146
  • 147
  • 148
  • 149
  • 150
  • 151
  • 152
  • 153
  • 154
  • 155
  • 156
  • 157
  • 158
  • 159
  • 160
  • 161
  • 162
  • 163
  • 164
  • 165
  • 166
  • 167
  • 168
  • 169
  • 170
  • 171
  • 172
  • 173
  • 174
  • 175
  • 176
  • 177
  • 178
  • 179
  • 180
  • 181
  • 182
  • 183
  • 184
  • 185
  • 186
  • 187
  • 188
  • 189
  • 190
  • 191
  • 192
  • 193
  • 194
  • 195
  • 196
  • 197
  • 198
  • 199
  • 200
  • 201
  • 202
  • 203
  • 204
  • 205
  • 206
  • 207
  • 208
  • 209
  • 210
  • 211
  • 212
  • 213
  • 214
  • 215
  • 216
  • 217
  • 218
  • 219
  • 220
  • 221
  • 222
  • 223
  • 224
  • 225
  • 226
  • 227
  • 228
  • 229
  • 230
  • 231
  • 232
  • 233
  • 234
  • 235
  • 236
  • 237
  • 238
  • 239
  • 240
  • 241
  • 242
  • 243
  • 244
  • 245
  • 246
  • 247
  • 248
  • 249
  • 250
  • 251
  • 252
  • 253
  • 254
  • 255
  • 256
  • 257
  • 258
  • 259
  • 260
  • 261
  • 262
  • 263
  • 264
  • 265
  • 266

52
Web Tools Administrator’s Guide
Publication Number: 53-1000435-01
Monitoring events
3
5.
To filter events up until a certain date and time, select the
To
check box and enter the finish
time and date.
6.
Click
OK
.
The filter is enabled and the window is refreshed to show the filtered information.
To filter events by event severity levels
1.
Open the Fabric Events window or the Switch Events tab as described in
“Displaying Fabric
Events”
on page 49 or
“Displaying Switch Events”
on page 50.
2.
Click
Filter
.
The Event Filter dialog box appears.
3.
Check
Level
.
4.
Check the event levels you want to display.
5.
Click
OK
.
The filter is enabled and the window is refreshed to show the filtered information.
To filter events by message ID
1.
Open the Fabric Events window or the Switch Events tab as described in
“Displaying Fabric
Events”
on page 49 or
“Displaying Switch Events”
on page 50.
2.
Click
Filter
.
The Event Filter dialog box displays.
3.
Check
Message ID
.
4.
Type the message IDs in the associated field.
You can enter multiple message IDs as long as you separate them by commas. You can type
either the full message ID (moduleID-messageType) or a partial ID (moduleID only). The
message ID filtering is case-sensitive.
5.
Click
OK
.
The filter is enabled and the window is refreshed to show the filtered information.
To filter events by service component
1.
Open the Fabric Events window or the Switch Events tab as described in
“Displaying Fabric
Events”
on page 49 or
“Displaying Switch Events”
on page 50.
2.
Click
Filter
.
The Event Filter dialog box displays.
3.
Check
Service
.
The event service drop-down menu is enabled.
4.
Select either
Switch
or
Chassis
from the drop-down menu to show only those messages from
the logical switch or from the chassis.
5.
Click
OK
.
The filter is enabled and the window is refreshed to show the filtered information.