HP StorageWorks 2/16V Brocade Web Tools Administrator's Guide - Supporting Fab - Page 185
Displaying Fabric Watch alarm information, Displaying an alarm configuration Report, Displaying alarms
 |
View all HP StorageWorks 2/16V manuals
Add to My Manuals
Save this manual to your list of manuals |
Page 185 highlights
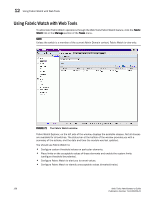
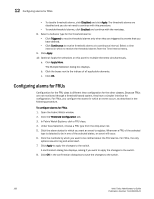
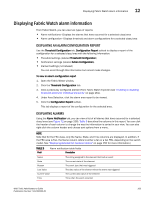
Displaying Fabric Watch alarm information 12 Displaying Fabric Watch alarm information From Fabric Watch, you can view two types of reports: • Alarm notifications-Displays the alarms that have occurred for a selected class/area • Alarm configuration-Displays threshold and alarm configurations for a selected class/area DISPLAYING AN ALARM CONFIGURATION REPORT Use the Threshold Configuration tab, Configuration Report subtab to display a report of the configuration for a selected class/area with the following information: • Threshold settings (labeled Threshold Configuration) • Notification settings (labeled Action Configuration) • Element settings (not labeled) You can scroll through this information but cannot make changes. To view an alarm configuration report 1. Open the Fabric Watch window. 2. Click the Threshold Configuration tab. 3. Click a previously configured element from Fabric Watch Explorer (see "Enabling or disabling threshold alarms for individual elements" on page 161). 4. Under Area Selection, click the alarm area report to be viewed. 5. Click the Configuration Report subtab. This tab displays a report of the configuration for the selected area. DISPLAYING ALARMS Using the Alarm Notification tab, you can view a list of all alarms that have occurred for a selected class/area (see Figure 72 on page 158). Table 9 describes the columns in this report. You can click the header of each column to change the way the information is sorted in your view. You can also right-click the column header and choose sort options from a menu. NOTE Note that for the FRU class, only the Name, State, and Time columns are displayed. In addition, if the FRU area is Fan, the Name column refers to either a fan or a fan FRU, depending on the switch model. See "Displaying detailed fan hardware status" on page 150 for more information.) TABLE 9 Field Alarm notification table fields Description Name State Reason Last Value Current Value Time The string assigned to the element that had an event The current state of the element The event type that was triggered The data value of the element when the event was triggered The current data value of the element Time when the event occurred Web Tools Administrator's Guide 163 Publication Number: 53-1000435-01
-
 1
1 -
2
-
3
-
4
-
5
-
6
-
7
-
8
-
9
-
10
-
11
-
12
-
13
-
14
-
15
-
16
-
17
-
18
-
19
-
20
-
21
-
22
-
23
-
24
-
25
-
26
-
27
-
28
-
29
-
30
-
31
-
32
-
33
-
34
-
35
-
36
-
37
-
38
-
39
-
40
-
41
-
42
-
43
-
44
-
45
-
46
-
47
-
48
-
49
-
50
-
51
-
52
-
53
-
54
-
55
-
56
-
57
-
58
-
59
-
60
-
61
-
62
-
63
-
64
-
65
-
66
-
67
-
68
-
69
-
70
-
71
-
72
-
73
-
74
-
75
-
76
-
77
-
78
-
79
-
80
-
81
-
82
-
83
-
84
-
85
-
86
-
87
-
88
-
89
-
90
-
91
-
92
-
93
-
94
-
95
-
96
-
97
-
98
-
99
-
100
-
101
-
102
-
103
-
104
-
105
-
106
-
107
-
108
-
109
-
110
-
111
-
112
-
113
-
114
-
115
-
116
-
117
-
118
-
119
-
120
-
121
-
122
-
123
-
124
-
125
-
126
-
127
-
128
-
129
-
130
-
131
-
132
-
133
-
134
-
135
-
136
-
137
-
138
-
139
-
140
-
141
-
142
-
143
-
144
-
145
-
146
-
147
-
148
-
149
-
150
-
151
-
152
-
153
-
154
-
155
-
156
-
157
-
158
-
159
-
160
-
161
-
162
-
163
-
164
-
165
-
166
-
167
-
168
-
169
-
170
-
171
-
172
-
173
-
174
-
175
-
176
-
177
-
178
-
179
-
 180
180 -
 181
181 -
 182
182 -
 183
183 -
 184
184 -
 185
185 -
 186
186 -
 187
187 -
 188
188 -
 189
189 -
 190
190 -
191
-
192
-
193
-
194
-
195
-
196
-
197
-
198
-
199
-
200
-
201
-
202
-
203
-
204
-
205
-
206
-
207
-
208
-
209
-
210
-
211
-
212
-
213
-
214
-
215
-
216
-
217
-
218
-
219
-
220
-
221
-
222
-
223
-
224
-
225
-
226
-
227
-
228
-
229
-
230
-
231
-
232
-
233
-
234
-
235
-
236
-
237
-
238
-
239
-
240
-
241
-
242
-
243
-
244
-
245
-
246
-
247
-
248
-
249
-
250
-
251
-
252
-
253
-
254
-
255
-
256
-
257
-
258
-
259
-
260
-
261
-
262
-
263
-
264
-
265
-
266
 |
 |