HP StorageWorks 2/16V Brocade Web Tools Administrator's Guide - Supporting Fab - Page 145
TABLE 6, Monitoring performance using Web Tools
 |
View all HP StorageWorks 2/16V manuals
Add to My Manuals
Save this manual to your list of manuals |
Page 145 highlights
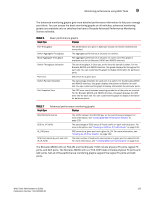
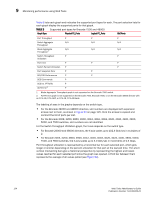
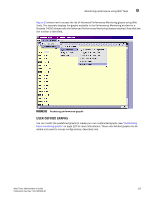
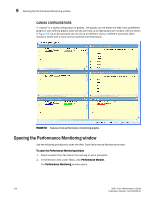
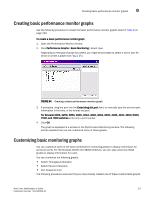
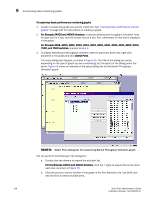
Monitoring performance using Web Tools 9 The advanced monitoring graphs give more detailed performance information to help you manage your fabric. You can access the basic monitoring graphs on all switches; advanced monitoring graphs are available only on switches that have a Brocade Advanced Performance Monitoring license activated. TABLE 6 Basic performance graphs Graph Type Displays Port Throughput Switch Aggregate Throughput Blade Aggregate Throughput Switch Throughput Utilization Port Error Switch Percent Utilization Port Snapshot Error The performance of a port, in bytes per second, for frames received and transmitted. The aggregate performance of all ports on a switch. The aggregate performance of all ports on a port card. This graph is available only for the Brocade 24000 and 48000 directors. The port throughput, in Gbit/sec, at the time the sample is taken. For the Brocade 24000 and 48000 directors, this graph displays the throughput for each slot. You can customize this graph to display information for particular ports. CRC errors for a given port. The percentage utilization for each port in a switch. For the Brocade 24000 and 48000 directors, this graph displays the percent utilization for each slot. You can customize this graph to display information for particular ports. The CRC error count between sampling periods for all the ports on a switch. For the Brocade 24000 and 48000 directors, this graph displays the CRC error rate for each slot. You can customize this graph to display information for particular ports. TABLE 7 Advanced performance monitoring graphs Graph Type Displays SID/DID Performance The traffic between the SID-DID pair on the switch being managed. For more information, see "Creating SID-DID Performance Graphs" on page 129. SCSI vs. IP Traffic The percentage of SCSI versus IP frame traffic on each individual port. For more information, see "Creating an SCSI vs. IP Traffic Graph" on page 130. AL_PA Errors SCSI Commands by port and LUN (R, W, R/W) CRC errors for a given port and a given AL_PA. For more information, see "Creating AL_PA Error Graphs" on page 132. The total number of read/write commands on a given port to a specific LUN. For more information, see "Creating SCSI Command Graphs" on page 131. The Brocade 48000 with an FC4-18i and the Brocade 7500 include physical FC ports, logical FC ports, and GbE ports. The Brocade 48000 with a or FC4-16IP blade includes physical FC ports and GbE ports. Not all of the performance monitoring graphs support the logical FC ports and GbE ports. Web Tools Administrator's Guide 123 Publication Number: 53-1000435-01
-
 1
1 -
2
-
3
-
4
-
5
-
6
-
7
-
8
-
9
-
10
-
11
-
12
-
13
-
14
-
15
-
16
-
17
-
18
-
19
-
20
-
21
-
22
-
23
-
24
-
25
-
26
-
27
-
28
-
29
-
30
-
31
-
32
-
33
-
34
-
35
-
36
-
37
-
38
-
39
-
40
-
41
-
42
-
43
-
44
-
45
-
46
-
47
-
48
-
49
-
50
-
51
-
52
-
53
-
54
-
55
-
56
-
57
-
58
-
59
-
60
-
61
-
62
-
63
-
64
-
65
-
66
-
67
-
68
-
69
-
70
-
71
-
72
-
73
-
74
-
75
-
76
-
77
-
78
-
79
-
80
-
81
-
82
-
83
-
84
-
85
-
86
-
87
-
88
-
89
-
90
-
91
-
92
-
93
-
94
-
95
-
96
-
97
-
98
-
99
-
100
-
101
-
102
-
103
-
104
-
105
-
106
-
107
-
108
-
109
-
110
-
111
-
112
-
113
-
114
-
115
-
116
-
117
-
118
-
119
-
120
-
121
-
122
-
123
-
124
-
125
-
126
-
127
-
128
-
129
-
130
-
131
-
132
-
133
-
134
-
135
-
136
-
137
-
138
-
139
-
 140
140 -
 141
141 -
 142
142 -
 143
143 -
 144
144 -
 145
145 -
 146
146 -
 147
147 -
 148
148 -
 149
149 -
 150
150 -
151
-
152
-
153
-
154
-
155
-
156
-
157
-
158
-
159
-
160
-
161
-
162
-
163
-
164
-
165
-
166
-
167
-
168
-
169
-
170
-
171
-
172
-
173
-
174
-
175
-
176
-
177
-
178
-
179
-
180
-
181
-
182
-
183
-
184
-
185
-
186
-
187
-
188
-
189
-
190
-
191
-
192
-
193
-
194
-
195
-
196
-
197
-
198
-
199
-
200
-
201
-
202
-
203
-
204
-
205
-
206
-
207
-
208
-
209
-
210
-
211
-
212
-
213
-
214
-
215
-
216
-
217
-
218
-
219
-
220
-
221
-
222
-
223
-
224
-
225
-
226
-
227
-
228
-
229
-
230
-
231
-
232
-
233
-
234
-
235
-
236
-
237
-
238
-
239
-
240
-
241
-
242
-
243
-
244
-
245
-
246
-
247
-
248
-
249
-
250
-
251
-
252
-
253
-
254
-
255
-
256
-
257
-
258
-
259
-
260
-
261
-
262
-
263
-
264
-
265
-
266
 |
 |