HP StorageWorks 2/16V Brocade Web Tools Administrator's Guide - Supporting Fab - Page 179
Administering Fabric Watch, In this Introduction to Fabric Watch
 |
View all HP StorageWorks 2/16V manuals
Add to My Manuals
Save this manual to your list of manuals |
Page 179 highlights
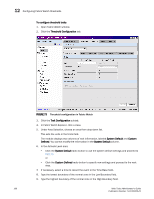
Chapter Administering Fabric Watch 12 In this chapter This chapter contains the following sections: • Introduction to Fabric Watch 157 • Using Fabric Watch with Web Tools 158 • Configuring Fabric Watch thresholds 159 • Configuring alarms for FRUs 162 • Displaying Fabric Watch alarm information 163 • Configuring email notifications 164 Introduction to Fabric Watch Fabric Watch is a Brocade optionally-licensed feature that monitors the performance and status of switches. Fabric Watch can automatically alert you when problems arise, before they become costly failures. NOTE Fabric Watch is view-only if you do not own the switch. Owning ports on a switch is not enough to enable Fabric Watch on that switch. To use Fabric Watch, you must have a Fabric Watch license installed on the switch. Fabric Watch tracks a number of SAN fabric elements, events, and counters. For example, Fabric Watch monitors: • Fabric resources, including fabric reconfigurations, zoning changes, and new logins. • Switch environmental functions, such as temperature, power supply, and fan status, along with security violations. • Port state transitions, errors, and traffic information for multiple port classes as well as operational values for supported models of Finisar "Smart" GBICs/SFPs. • Performance information for AL_PA, end-to-end, and SCSI command metrics. Fabric Watch lets you define how often to measure each switch and fabric element and allows you to specify notification thresholds. Whenever fabric elements exceed these thresholds, Fabric Watch automatically provides notification using several methods, including email messages, SNMP traps, and log entries. For detailed information regarding Fabric Watch, see the Fabric Watch Administrator's Guide. Web Tools Administrator's Guide 157 Publication Number: 53-1000435-01
-
 1
1 -
2
-
3
-
4
-
5
-
6
-
7
-
8
-
9
-
10
-
11
-
12
-
13
-
14
-
15
-
16
-
17
-
18
-
19
-
20
-
21
-
22
-
23
-
24
-
25
-
26
-
27
-
28
-
29
-
30
-
31
-
32
-
33
-
34
-
35
-
36
-
37
-
38
-
39
-
40
-
41
-
42
-
43
-
44
-
45
-
46
-
47
-
48
-
49
-
50
-
51
-
52
-
53
-
54
-
55
-
56
-
57
-
58
-
59
-
60
-
61
-
62
-
63
-
64
-
65
-
66
-
67
-
68
-
69
-
70
-
71
-
72
-
73
-
74
-
75
-
76
-
77
-
78
-
79
-
80
-
81
-
82
-
83
-
84
-
85
-
86
-
87
-
88
-
89
-
90
-
91
-
92
-
93
-
94
-
95
-
96
-
97
-
98
-
99
-
100
-
101
-
102
-
103
-
104
-
105
-
106
-
107
-
108
-
109
-
110
-
111
-
112
-
113
-
114
-
115
-
116
-
117
-
118
-
119
-
120
-
121
-
122
-
123
-
124
-
125
-
126
-
127
-
128
-
129
-
130
-
131
-
132
-
133
-
134
-
135
-
136
-
137
-
138
-
139
-
140
-
141
-
142
-
143
-
144
-
145
-
146
-
147
-
148
-
149
-
150
-
151
-
152
-
153
-
154
-
155
-
156
-
157
-
158
-
159
-
160
-
161
-
162
-
163
-
164
-
165
-
166
-
167
-
168
-
169
-
170
-
171
-
172
-
173
-
 174
174 -
 175
175 -
 176
176 -
 177
177 -
 178
178 -
 179
179 -
 180
180 -
 181
181 -
 182
182 -
 183
183 -
 184
184 -
185
-
186
-
187
-
188
-
189
-
190
-
191
-
192
-
193
-
194
-
195
-
196
-
197
-
198
-
199
-
200
-
201
-
202
-
203
-
204
-
205
-
206
-
207
-
208
-
209
-
210
-
211
-
212
-
213
-
214
-
215
-
216
-
217
-
218
-
219
-
220
-
221
-
222
-
223
-
224
-
225
-
226
-
227
-
228
-
229
-
230
-
231
-
232
-
233
-
234
-
235
-
236
-
237
-
238
-
239
-
240
-
241
-
242
-
243
-
244
-
245
-
246
-
247
-
248
-
249
-
250
-
251
-
252
-
253
-
254
-
255
-
256
-
257
-
258
-
259
-
260
-
261
-
262
-
263
-
264
-
265
-
266
 |
 |