HP DesignJet T850 DesignJet T850 Printer Series DesignJet T950 Printer SeriesU - Page 158
Scan or copy the diagnostic plot, Monitor calibration, File type: JPG
 |
View all HP DesignJet T850 manuals
Add to My Manuals
Save this manual to your list of manuals |
Page 158 highlights
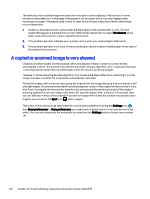
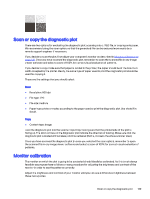
Scan or copy the diagnostic plot There are two options for evaluating the diagnostic plot: scanning into a JPEG file, or copying onto paper. We recommend using the scan option, so that the generated file can be analyzed more easily by a remote support engineer if necessary. If you decide to scan the plot, first adjust your computer's monitor as described in Monitor calibration on page 149. Once you have scanned the diagnostic plot, remember to open the scanned file in any image viewer software and select a zoom of 100% for correct visual evaluation of patterns. If you decide to copy, make sure that paper is loaded in the printer; the paper should be of the maximum width accepted by the printer. Ideally, the same type of paper used to print the diagnostic plot should be used for copying it. These are the settings that you should select: Scan ● Resolution: 600 dpi ● File type: JPG ● File size: medium ● Paper type: photo or matte, according to the paper used to print the diagnostic plot. Use photo if in doubt. Copy ● Content type: Image Load the diagnostic plot into the scanner input tray, making sure that the printed side of the plot is facing up. The black arrows on the diagnostic plot indicate the direction of loading. Make sure that the diagnostic plot is loaded without skew, and it is centered (that is, it covers the whole scanner area). Once you have scanned the diagnostic plot (in case you selected the scan option), remember to open the scanned file in any image viewer software and select a zoom of 100% for correct visual evaluation of patterns. Monitor calibration The monitor on which the plot is going to be evaluated should ideally be calibrated. As this is not always feasible, we propose here to follow an easy procedure for adjusting the brightness and contrast of the monitor in order to see the patterns correctly. Adjust the brightness and contrast of your monitor until you can see a difference in lightness between these two squares: Scan or copy the diagnostic plot 149
-
 1
1 -
2
-
3
-
4
-
5
-
6
-
7
-
8
-
9
-
10
-
11
-
12
-
13
-
14
-
15
-
16
-
17
-
18
-
19
-
20
-
21
-
22
-
23
-
24
-
25
-
26
-
27
-
28
-
29
-
30
-
31
-
32
-
33
-
34
-
35
-
36
-
37
-
38
-
39
-
40
-
41
-
42
-
43
-
44
-
45
-
46
-
47
-
48
-
49
-
50
-
51
-
52
-
53
-
54
-
55
-
56
-
57
-
58
-
59
-
60
-
61
-
62
-
63
-
64
-
65
-
66
-
67
-
68
-
69
-
70
-
71
-
72
-
73
-
74
-
75
-
76
-
77
-
78
-
79
-
80
-
81
-
82
-
83
-
84
-
85
-
86
-
87
-
88
-
89
-
90
-
91
-
92
-
93
-
94
-
95
-
96
-
97
-
98
-
99
-
100
-
101
-
102
-
103
-
104
-
105
-
106
-
107
-
108
-
109
-
110
-
111
-
112
-
113
-
114
-
115
-
116
-
117
-
118
-
119
-
120
-
121
-
122
-
123
-
124
-
125
-
126
-
127
-
128
-
129
-
130
-
131
-
132
-
133
-
134
-
135
-
136
-
137
-
138
-
139
-
140
-
141
-
142
-
143
-
144
-
145
-
146
-
147
-
148
-
149
-
150
-
151
-
152
-
 153
153 -
 154
154 -
 155
155 -
 156
156 -
 157
157 -
 158
158 -
 159
159 -
 160
160 -
 161
161 -
 162
162 -
 163
163 -
164
-
165
-
166
-
167
-
168
-
169
-
170
-
171
-
172
-
173
-
174
-
175
-
176
-
177
-
178
-
179
-
180
-
181
-
182
-
183
-
184
-
185
-
186
-
187
-
188
-
189
-
190
-
191
 |
 |