Adobe 22011292 User Guide - Page 118
Graph, Splines, Invert
 |
UPC - 883919139081
View all Adobe 22011292 manuals
Add to My Manuals
Save this manual to your list of manuals |
Page 118 highlights
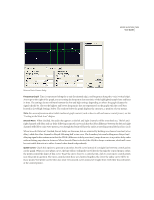
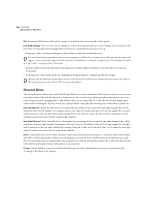
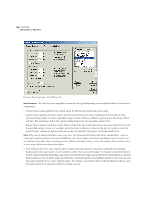
104 CHAPTER 8 Effects Menu - Edit View Graph The graph depicts input level along the x-axis (left and right) and the new output level along the y-axis (up and down). A line that flows directly from the lower-left to the upper-right (default) depicts a signal that has been left untouched, since every input value goes to the exact matching output value. Adjusting the shape of this line will adjust the input or output assignments, thereby altering the dynamic range. For example, you can boost all input that has a level of around -20dB, leaving everything else unchanged. You can also draw an inverse line (a line from upper-left to lower-right) that will dramatically boost low amplitudes while dramatically suppressing high amplitudes (that is, all quiet sounds will be loud, and all loud sounds will be quiet). Note: For more information about Adobe Audition's graph controls (such as how to add and remove control points), see the "Looking at the Work Area" chapter. Splines Check this option to generate a smoother, best fit curve instead of a straight line between control points on the graph. When you use Splines, the line will not ordinarily travel directly through the control points; rather, the points control the shape of this curve. To get the curve closer to a control point, click to create more control points near the point in question. The more control points there are clustered together, the closer the spline curve will be to those points. Use Spline Curves when you want very smooth curves instead of straight lines (with their discontinuities at the control points). Flat The Flat button resets the graph to its default state of an unchanged signal, removing all control points. Invert The Invert button changes the graph to one that will function as the exact opposite. For example, if an effect function with a compressor characteristic is being displayed, pressing Invert changes the graph to one with the corresponding expander characteristic. Note: For a graph to be invertible, it must have points in the two default corners (-100, -100 and 0, 0) and its output level must always increase from left to right (i.e., each control point must be higher than the one to its left).
-
 1
1 -
2
-
3
-
4
-
5
-
6
-
7
-
8
-
9
-
10
-
11
-
12
-
13
-
14
-
15
-
16
-
17
-
18
-
19
-
20
-
21
-
22
-
23
-
24
-
25
-
26
-
27
-
28
-
29
-
30
-
31
-
32
-
33
-
34
-
35
-
36
-
37
-
38
-
39
-
40
-
41
-
42
-
43
-
44
-
45
-
46
-
47
-
48
-
49
-
50
-
51
-
52
-
53
-
54
-
55
-
56
-
57
-
58
-
59
-
60
-
61
-
62
-
63
-
64
-
65
-
66
-
67
-
68
-
69
-
70
-
71
-
72
-
73
-
74
-
75
-
76
-
77
-
78
-
79
-
80
-
81
-
82
-
83
-
84
-
85
-
86
-
87
-
88
-
89
-
90
-
91
-
92
-
93
-
94
-
95
-
96
-
97
-
98
-
99
-
100
-
101
-
102
-
103
-
104
-
105
-
106
-
107
-
108
-
109
-
110
-
111
-
112
-
 113
113 -
 114
114 -
 115
115 -
 116
116 -
 117
117 -
 118
118 -
 119
119 -
 120
120 -
 121
121 -
 122
122 -
 123
123 -
124
-
125
-
126
-
127
-
128
-
129
-
130
-
131
-
132
-
133
-
134
-
135
-
136
-
137
-
138
-
139
-
140
-
141
-
142
-
143
-
144
-
145
-
146
-
147
-
148
-
149
-
150
-
151
-
152
-
153
-
154
-
155
-
156
-
157
-
158
-
159
-
160
-
161
-
162
-
163
-
164
-
165
-
166
-
167
-
168
-
169
-
170
-
171
-
172
-
173
-
174
-
175
-
176
-
177
-
178
-
179
-
180
-
181
-
182
-
183
-
184
-
185
-
186
-
187
-
188
-
189
-
190
-
191
-
192
-
193
-
194
-
195
-
196
-
197
-
198
-
199
-
200
-
201
-
202
-
203
-
204
-
205
-
206
-
207
-
208
-
209
-
210
-
211
-
212
-
213
-
214
-
215
-
216
-
217
-
218
-
219
-
220
-
221
-
222
-
223
-
224
-
225
-
226
-
227
-
228
-
229
-
230
-
231
-
232
-
233
-
234
-
235
-
236
-
237
-
238
-
239
-
240
-
241
-
242
-
243
-
244
-
245
-
246
-
247
-
248
-
249
-
250
-
251
-
252
-
253
-
254
-
255
-
256
-
257
-
258
-
259
-
260
-
261
-
262
-
263
-
264
-
265
-
266
-
267
-
268
-
269
-
270
-
271
-
272
-
273
-
274
-
275
-
276
-
277
-
278
-
279
-
280
-
281
-
282
-
283
-
284
-
285
-
286
-
287
-
288
-
289
-
290
-
291
-
292
-
293
-
294
-
295
-
296
-
297
-
298
-
299
-
300
-
301
-
302
-
303
-
304
-
305
-
306
-
307
-
308
-
309
-
310
-
311
-
312
-
313
-
314
-
315
-
316
-
317
-
318
-
319
-
320
-
321
-
322
-
323
-
324
-
325
-
326
-
327
-
328
-
329
-
330
-
331
-
332
-
333
-
334
-
335
-
336
-
337
-
338
-
339
-
340
-
341
-
342
-
343
-
344
-
345
-
346
-
347
-
348
-
349
-
350
-
351
-
352
-
353
-
354
-
355
-
356
-
357
-
358
-
359
-
360
-
361
-
362
-
363
-
364
-
365
-
366
-
367
-
368
-
369
-
370
-
371
-
372
-
373
-
374
-
375
-
376
-
377
-
378
-
379
-
380
-
381
-
382
-
383
-
384
-
385
-
386
-
387
-
388
-
389
-
390
 |
 |
