Adobe 22011292 User Guide - Page 186
Save Profile, Get Profile from Selection, Snapshots in profile, Reduction Graph, Log Scale
 |
UPC - 883919139081
View all Adobe 22011292 manuals
Add to My Manuals
Save this manual to your list of manuals |
Page 186 highlights
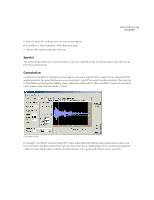
172 CHAPTER 8 Effects Menu - Edit View Note: A noise profile can only be used on a sample of the same type as when saved. In other words, a 44K stereo 8-bit sample is not compatible with a 22 kHz mono 16-bit profile. Bear in mind, however, that because noise profiles are so specific to the recording environment of the waveform in question, even if the sample types are compatible, a profile for one type of noise is likely to not produce good results when used for another type of noise. Even if the audio samples were recorded with the same microphone, if the recording environment is different, the type of background noise could be different. Save Profile Once the noise level is set, you can save the noise profile as an .fft file. This file will contain information on sample type, FFT (Fast Fourier Transform) size, and three sets of FFT coefficients: one for the lowest amount of noise found, one for the highest amount, and one for the power average. Get Profile from Selection Press this button to extract a noise profile from the highlighted selection. Try to select a portion of the waveform that has no important signal in it (i.e., it only has background noise), and then press Get Profile from Selection. Adobe Audition will gather the statistical information about the background noise, after which you can remove all noise of this type from your waveform. Note: If the selection used for gathering the noise level is too small, then the Get Profile from Selection button won't be enabled. Reduce the FFT Size or select a larger section of noise to sample. If you can't find a longer noise section, use Copy and Paste to create one. Highlight and copy the short noise sample. Then, paste this new instance at the end of original highlighted sample. Repeat this process until the sample has been extended long enough for the Get Profile from Selection button to be enabled. You can then perform as many Undos as necessary to remove the extra samples you've pasted. Snapshots in profile The number in this field describes how many snapshots of noise to take in the highlighted interval when the Get Profile from Selection button is pressed. The larger this number, the more accurate the statistical data is. A value of 64 is usually sufficient. You'll notice that using very small numbers of statistical samples will greatly affect the quality of the various noise reduction levels. With more samples, a noise reduction level of 100 will likely cut out more noise, but also cut out more original signal as well. However, a low noise reduction level with more samples will also cut out more noise, but likely will not disrupt the intended signal. Reduction Graph Use the Reduction Graph to set the amount of noise reduction at certain frequency ranges. For example, if you need noise reduction only in the higher frequencies, adjust the chart to give less noise reduction in the low frequencies, or alternatively, more reduction in the higher frequencies. The graph depicts frequency along the x-axis (left and right) and the amount of noise reduction (in percent) along the y-axis (up and down). If the line is set to Flat (which is accomplished by pressing the Flat button), then the amount of noise reduction used is based on the noise profile exactly. The readout below the graph displays the frequency and adjustment percentage at the current position of your mouse. Note: For more information about Adobe Audition's graph controls (such as how to add and remove control points), see the "Looking at the Work Area" chapter. Log Scale You can view the chart of the noise profile in either linear or logarithmic fashion. • Check Log Scale to divide the graph evenly into 10 octaves.
-
 1
1 -
2
-
3
-
4
-
5
-
6
-
7
-
8
-
9
-
10
-
11
-
12
-
13
-
14
-
15
-
16
-
17
-
18
-
19
-
20
-
21
-
22
-
23
-
24
-
25
-
26
-
27
-
28
-
29
-
30
-
31
-
32
-
33
-
34
-
35
-
36
-
37
-
38
-
39
-
40
-
41
-
42
-
43
-
44
-
45
-
46
-
47
-
48
-
49
-
50
-
51
-
52
-
53
-
54
-
55
-
56
-
57
-
58
-
59
-
60
-
61
-
62
-
63
-
64
-
65
-
66
-
67
-
68
-
69
-
70
-
71
-
72
-
73
-
74
-
75
-
76
-
77
-
78
-
79
-
80
-
81
-
82
-
83
-
84
-
85
-
86
-
87
-
88
-
89
-
90
-
91
-
92
-
93
-
94
-
95
-
96
-
97
-
98
-
99
-
100
-
101
-
102
-
103
-
104
-
105
-
106
-
107
-
108
-
109
-
110
-
111
-
112
-
113
-
114
-
115
-
116
-
117
-
118
-
119
-
120
-
121
-
122
-
123
-
124
-
125
-
126
-
127
-
128
-
129
-
130
-
131
-
132
-
133
-
134
-
135
-
136
-
137
-
138
-
139
-
140
-
141
-
142
-
143
-
144
-
145
-
146
-
147
-
148
-
149
-
150
-
151
-
152
-
153
-
154
-
155
-
156
-
157
-
158
-
159
-
160
-
161
-
162
-
163
-
164
-
165
-
166
-
167
-
168
-
169
-
170
-
171
-
172
-
173
-
174
-
175
-
176
-
177
-
178
-
179
-
180
-
 181
181 -
 182
182 -
 183
183 -
 184
184 -
 185
185 -
 186
186 -
 187
187 -
 188
188 -
 189
189 -
 190
190 -
 191
191 -
192
-
193
-
194
-
195
-
196
-
197
-
198
-
199
-
200
-
201
-
202
-
203
-
204
-
205
-
206
-
207
-
208
-
209
-
210
-
211
-
212
-
213
-
214
-
215
-
216
-
217
-
218
-
219
-
220
-
221
-
222
-
223
-
224
-
225
-
226
-
227
-
228
-
229
-
230
-
231
-
232
-
233
-
234
-
235
-
236
-
237
-
238
-
239
-
240
-
241
-
242
-
243
-
244
-
245
-
246
-
247
-
248
-
249
-
250
-
251
-
252
-
253
-
254
-
255
-
256
-
257
-
258
-
259
-
260
-
261
-
262
-
263
-
264
-
265
-
266
-
267
-
268
-
269
-
270
-
271
-
272
-
273
-
274
-
275
-
276
-
277
-
278
-
279
-
280
-
281
-
282
-
283
-
284
-
285
-
286
-
287
-
288
-
289
-
290
-
291
-
292
-
293
-
294
-
295
-
296
-
297
-
298
-
299
-
300
-
301
-
302
-
303
-
304
-
305
-
306
-
307
-
308
-
309
-
310
-
311
-
312
-
313
-
314
-
315
-
316
-
317
-
318
-
319
-
320
-
321
-
322
-
323
-
324
-
325
-
326
-
327
-
328
-
329
-
330
-
331
-
332
-
333
-
334
-
335
-
336
-
337
-
338
-
339
-
340
-
341
-
342
-
343
-
344
-
345
-
346
-
347
-
348
-
349
-
350
-
351
-
352
-
353
-
354
-
355
-
356
-
357
-
358
-
359
-
360
-
361
-
362
-
363
-
364
-
365
-
366
-
367
-
368
-
369
-
370
-
371
-
372
-
373
-
374
-
375
-
376
-
377
-
378
-
379
-
380
-
381
-
382
-
383
-
384
-
385
-
386
-
387
-
388
-
389
-
390
 |
 |
