Adobe 22011292 User Guide - Page 137
Work Area
 |
UPC - 883919139081
View all Adobe 22011292 manuals
Add to My Manuals
Save this manual to your list of manuals |
Page 137 highlights
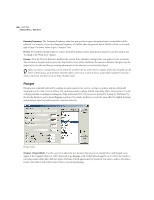
ADOBE AUDITION 123 User Guide Feedback Graph Use the Feedback Graph to specify the amount of feedback in the Dynamic Delay effect. The x-axis (horizontal edge) represents the timeline of the selection, while the y-axis (vertical edge) represents the percentage of feedback. Functionally, the Feedback Graph works just like any other Adobe Audition graph control. For more information about Adobe Audition's graph controls (such as how to add and remove control points), see the "Looking at the Work Area" chapter. Loop Graphs When this box is unchecked, the graphs are the same length as your selection, so the dynamic changes to your delay are graphed across the whole selection. If you check Loop Graphs, the graphs are only as long as specified, so they loop repeatedly over the course of the selection. Checking Loop Graphs also enables the Frequency, Period, Total Cycles, and Stereo Phasing fields. Frequency, Period, and Total Cycles are all ways of determining the length of the looped section. You can either specify the how fast the cycle should move (Frequency), how long the graphs should be (Period), or how many times you want the graph to loop in the given selection (Total Cycles). If you change one of these values, the other two reflect the change. Stereo Curve Difference This setting is only effective when Dynamic Delay is used in Adobe Audition's Multitrack View. It's the number of milliseconds one channel is behind with respect to the other when following the envelope you draw in Multitrack View. Positive values will delay the right channel, while negative values will delay the left. The audio itself isn't delayed, just the curve used. This leads to a neat effect where the phasing sound of the delay lags in one channel with respect to the other. Automated When using Dynamic Delay as a real-time effect in Multitrack View, it supports parameter automation. Check the Automated box in the Delay section of the Multitrack View version of the Dynamic dialog to draw the Delay curve using a purple envelope on waveform blocks. Note: You must have View > Show FX Parameter Envelopes in Multitrack View turned on in order to use parameter automation. Echo This function adds a series of repeated, decaying echoes to a sound. (For a single echo, use the Delay function instead).
-
 1
1 -
2
-
3
-
4
-
5
-
6
-
7
-
8
-
9
-
10
-
11
-
12
-
13
-
14
-
15
-
16
-
17
-
18
-
19
-
20
-
21
-
22
-
23
-
24
-
25
-
26
-
27
-
28
-
29
-
30
-
31
-
32
-
33
-
34
-
35
-
36
-
37
-
38
-
39
-
40
-
41
-
42
-
43
-
44
-
45
-
46
-
47
-
48
-
49
-
50
-
51
-
52
-
53
-
54
-
55
-
56
-
57
-
58
-
59
-
60
-
61
-
62
-
63
-
64
-
65
-
66
-
67
-
68
-
69
-
70
-
71
-
72
-
73
-
74
-
75
-
76
-
77
-
78
-
79
-
80
-
81
-
82
-
83
-
84
-
85
-
86
-
87
-
88
-
89
-
90
-
91
-
92
-
93
-
94
-
95
-
96
-
97
-
98
-
99
-
100
-
101
-
102
-
103
-
104
-
105
-
106
-
107
-
108
-
109
-
110
-
111
-
112
-
113
-
114
-
115
-
116
-
117
-
118
-
119
-
120
-
121
-
122
-
123
-
124
-
125
-
126
-
127
-
128
-
129
-
130
-
131
-
 132
132 -
 133
133 -
 134
134 -
 135
135 -
 136
136 -
 137
137 -
 138
138 -
 139
139 -
 140
140 -
 141
141 -
 142
142 -
143
-
144
-
145
-
146
-
147
-
148
-
149
-
150
-
151
-
152
-
153
-
154
-
155
-
156
-
157
-
158
-
159
-
160
-
161
-
162
-
163
-
164
-
165
-
166
-
167
-
168
-
169
-
170
-
171
-
172
-
173
-
174
-
175
-
176
-
177
-
178
-
179
-
180
-
181
-
182
-
183
-
184
-
185
-
186
-
187
-
188
-
189
-
190
-
191
-
192
-
193
-
194
-
195
-
196
-
197
-
198
-
199
-
200
-
201
-
202
-
203
-
204
-
205
-
206
-
207
-
208
-
209
-
210
-
211
-
212
-
213
-
214
-
215
-
216
-
217
-
218
-
219
-
220
-
221
-
222
-
223
-
224
-
225
-
226
-
227
-
228
-
229
-
230
-
231
-
232
-
233
-
234
-
235
-
236
-
237
-
238
-
239
-
240
-
241
-
242
-
243
-
244
-
245
-
246
-
247
-
248
-
249
-
250
-
251
-
252
-
253
-
254
-
255
-
256
-
257
-
258
-
259
-
260
-
261
-
262
-
263
-
264
-
265
-
266
-
267
-
268
-
269
-
270
-
271
-
272
-
273
-
274
-
275
-
276
-
277
-
278
-
279
-
280
-
281
-
282
-
283
-
284
-
285
-
286
-
287
-
288
-
289
-
290
-
291
-
292
-
293
-
294
-
295
-
296
-
297
-
298
-
299
-
300
-
301
-
302
-
303
-
304
-
305
-
306
-
307
-
308
-
309
-
310
-
311
-
312
-
313
-
314
-
315
-
316
-
317
-
318
-
319
-
320
-
321
-
322
-
323
-
324
-
325
-
326
-
327
-
328
-
329
-
330
-
331
-
332
-
333
-
334
-
335
-
336
-
337
-
338
-
339
-
340
-
341
-
342
-
343
-
344
-
345
-
346
-
347
-
348
-
349
-
350
-
351
-
352
-
353
-
354
-
355
-
356
-
357
-
358
-
359
-
360
-
361
-
362
-
363
-
364
-
365
-
366
-
367
-
368
-
369
-
370
-
371
-
372
-
373
-
374
-
375
-
376
-
377
-
378
-
379
-
380
-
381
-
382
-
383
-
384
-
385
-
386
-
387
-
388
-
389
-
390
 |
 |
