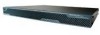
Cisco IPS-4255-K9 Installation Guide - Page 355
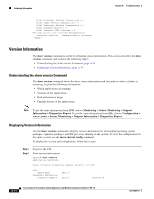
Understanding the show statistics Command, Displaying Statistics
 |
UPC - 746320951096
View all Cisco IPS-4255-K9 manuals
Add to My Manuals
Save this manual to your list of manuals |
Page 355 highlights
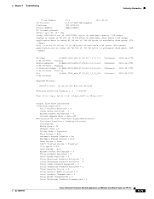
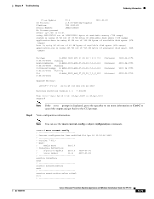
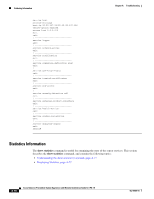
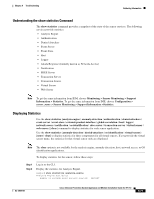
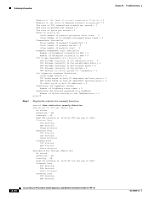
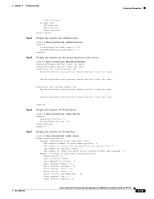
Chapter A Troubleshooting Gathering Information Understanding the show statistics Command The show statistics command provides a snapshot of the state of the sensor services. The following services provide statistics: • Analysis Engine • Authentication • Denied Attackers • Event Server • Event Store • Host • Logger • Attack Response (formerly known as Network Access) • Notification • SDEE Server • Transaction Server • Transaction Source • Virtual Sensor • Web Server Note To get the same information from IDM, choose Monitoring > Sensor Monitoring > Support Information > Statistics. To get the same information from IME, choose Configuration > sensor_name > Sensor Monitoring > Support Information >Statistics. Displaying Statistics Use the show statistics [analysis-engine | anomaly-detection | authentication | denied-attackers | event-server | event-store | external-product-interface | global-correlation | host | logger | network-access | notification | os-identification | sdee-server | transaction-server | virtual-sensor | web-server] [clear] command to display statistics for each sensor application. Use the show statistics {anomaly-detection | denied-attackers | os-identification | virtual-sensor} [name | clear] to display statistics for these components for all virtual sensors. If you provide the virtual sensor name, the statistics for that virtual sensor only are displayed. Note The clear option is not available for the analysis engine, anomaly detection, host, network access, or OS identification applications. To display statistics for the sensor, follow these steps: Step 1 Step 2 Log in to the CLI. Display the statistics for Analysis Engine. sensor# show statistics analysis-engine Analysis Engine Statistics Number of seconds since service started = 1421127 OL-18504-01 Cisco Intrusion Prevention System Appliance and Module Installation Guide for IPS 7.0 A-77
-
 1
1 -
2
-
3
-
4
-
5
-
6
-
7
-
8
-
9
-
10
-
11
-
12
-
13
-
14
-
15
-
16
-
17
-
18
-
19
-
20
-
21
-
22
-
23
-
24
-
25
-
26
-
27
-
28
-
29
-
30
-
31
-
32
-
33
-
34
-
35
-
36
-
37
-
38
-
39
-
40
-
41
-
42
-
43
-
44
-
45
-
46
-
47
-
48
-
49
-
50
-
51
-
52
-
53
-
54
-
55
-
56
-
57
-
58
-
59
-
60
-
61
-
62
-
63
-
64
-
65
-
66
-
67
-
68
-
69
-
70
-
71
-
72
-
73
-
74
-
75
-
76
-
77
-
78
-
79
-
80
-
81
-
82
-
83
-
84
-
85
-
86
-
87
-
88
-
89
-
90
-
91
-
92
-
93
-
94
-
95
-
96
-
97
-
98
-
99
-
100
-
101
-
102
-
103
-
104
-
105
-
106
-
107
-
108
-
109
-
110
-
111
-
112
-
113
-
114
-
115
-
116
-
117
-
118
-
119
-
120
-
121
-
122
-
123
-
124
-
125
-
126
-
127
-
128
-
129
-
130
-
131
-
132
-
133
-
134
-
135
-
136
-
137
-
138
-
139
-
140
-
141
-
142
-
143
-
144
-
145
-
146
-
147
-
148
-
149
-
150
-
151
-
152
-
153
-
154
-
155
-
156
-
157
-
158
-
159
-
160
-
161
-
162
-
163
-
164
-
165
-
166
-
167
-
168
-
169
-
170
-
171
-
172
-
173
-
174
-
175
-
176
-
177
-
178
-
179
-
180
-
181
-
182
-
183
-
184
-
185
-
186
-
187
-
188
-
189
-
190
-
191
-
192
-
193
-
194
-
195
-
196
-
197
-
198
-
199
-
200
-
201
-
202
-
203
-
204
-
205
-
206
-
207
-
208
-
209
-
210
-
211
-
212
-
213
-
214
-
215
-
216
-
217
-
218
-
219
-
220
-
221
-
222
-
223
-
224
-
225
-
226
-
227
-
228
-
229
-
230
-
231
-
232
-
233
-
234
-
235
-
236
-
237
-
238
-
239
-
240
-
241
-
242
-
243
-
244
-
245
-
246
-
247
-
248
-
249
-
250
-
251
-
252
-
253
-
254
-
255
-
256
-
257
-
258
-
259
-
260
-
261
-
262
-
263
-
264
-
265
-
266
-
267
-
268
-
269
-
270
-
271
-
272
-
273
-
274
-
275
-
276
-
277
-
278
-
279
-
280
-
281
-
282
-
283
-
284
-
285
-
286
-
287
-
288
-
289
-
290
-
291
-
292
-
293
-
294
-
295
-
296
-
297
-
298
-
299
-
300
-
301
-
302
-
303
-
304
-
305
-
306
-
307
-
308
-
309
-
310
-
311
-
312
-
313
-
314
-
315
-
316
-
317
-
318
-
319
-
320
-
321
-
322
-
323
-
324
-
325
-
326
-
327
-
328
-
329
-
330
-
331
-
332
-
333
-
334
-
335
-
336
-
337
-
338
-
339
-
340
-
341
-
342
-
343
-
344
-
345
-
346
-
347
-
348
-
349
-
 350
350 -
 351
351 -
 352
352 -
 353
353 -
 354
354 -
 355
355 -
 356
356 -
 357
357 -
 358
358 -
 359
359 -
 360
360 -
361
-
362
-
363
-
364
-
365
-
366
-
367
-
368
-
369
-
370
-
371
-
372
-
373
-
374
-
375
-
376
-
377
-
378
-
379
-
380
-
381
-
382
-
383
-
384
-
385
-
386
-
387
-
388
-
389
-
390
-
391
-
392
-
393
-
394
-
395
-
396
-
397
-
398
-
399
-
400
-
401
-
402
-
403
-
404
-
405
-
406
-
407
-
408
-
409
-
410
-
411
-
412
 |
 |