Netgear M4100-26G CLI Manual - Page 743
show green-mode eee-lpi-history interface <slot/port>
 |
View all Netgear M4100-26G manuals
Add to My Manuals
Save this manual to your list of manuals |
Page 743 highlights
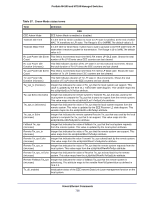
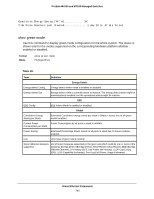
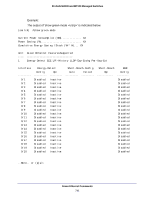
ProSafe M4100 and M7100 Managed Switches show green-mode eee-lpi-history interface This command displays the interface green-mode EEE LPI history. Format Mode show green-mode eee-lpi-history interface Privileged Exec Table 59. Keyword Description Sampling Interval Interval at which EEE LPI statistics is collected. Total No. of Samples to Keep Maximum number of samples to keep Percentage LPI time per stack Percentage of Total time spent in LPI mode by all port in stack when compared to total time since reset. Sample No Sample Index Sample Time Time since last reset %time spent in LPI mode since last sample Percentage of time spent in LPI mode on this port when compared to sampling interval %time spent in LPI mode since last reset Percentage of total time spent in LPI mode on this port when compared to time since reset. Example: (switch)#show green-mode eee-lpi-history interface 0/1 Sampling Interval (sec 30 Total No. of Samples to Keep 168 Percentage LPI time per stack 29 Sample Time Since No. The Sample Was Recorded 10 0d:00:00:13 9 0d:00:00:44 8 0d:00:01:15 7 0d:00:01:46 6 0d:00:02:18 5 0d:00:02:49 4 0d:00:03:20 3 0d:00:03:51 2 0d:00:04:22 1 0d:00:04:53 Percentage of Time spent in LPI mode since last sample 3 3 3 3 3 3 3 3 3 3 Percentage of Time spent in LPI mode since last reset 2 2 2 2 2 2 2 1 1 1 Green Ethernet Commands 743
-
 1
1 -
2
-
3
-
4
-
5
-
6
-
7
-
8
-
9
-
10
-
11
-
12
-
13
-
14
-
15
-
16
-
17
-
18
-
19
-
20
-
21
-
22
-
23
-
24
-
25
-
26
-
27
-
28
-
29
-
30
-
31
-
32
-
33
-
34
-
35
-
36
-
37
-
38
-
39
-
40
-
41
-
42
-
43
-
44
-
45
-
46
-
47
-
48
-
49
-
50
-
51
-
52
-
53
-
54
-
55
-
56
-
57
-
58
-
59
-
60
-
61
-
62
-
63
-
64
-
65
-
66
-
67
-
68
-
69
-
70
-
71
-
72
-
73
-
74
-
75
-
76
-
77
-
78
-
79
-
80
-
81
-
82
-
83
-
84
-
85
-
86
-
87
-
88
-
89
-
90
-
91
-
92
-
93
-
94
-
95
-
96
-
97
-
98
-
99
-
100
-
101
-
102
-
103
-
104
-
105
-
106
-
107
-
108
-
109
-
110
-
111
-
112
-
113
-
114
-
115
-
116
-
117
-
118
-
119
-
120
-
121
-
122
-
123
-
124
-
125
-
126
-
127
-
128
-
129
-
130
-
131
-
132
-
133
-
134
-
135
-
136
-
137
-
138
-
139
-
140
-
141
-
142
-
143
-
144
-
145
-
146
-
147
-
148
-
149
-
150
-
151
-
152
-
153
-
154
-
155
-
156
-
157
-
158
-
159
-
160
-
161
-
162
-
163
-
164
-
165
-
166
-
167
-
168
-
169
-
170
-
171
-
172
-
173
-
174
-
175
-
176
-
177
-
178
-
179
-
180
-
181
-
182
-
183
-
184
-
185
-
186
-
187
-
188
-
189
-
190
-
191
-
192
-
193
-
194
-
195
-
196
-
197
-
198
-
199
-
200
-
201
-
202
-
203
-
204
-
205
-
206
-
207
-
208
-
209
-
210
-
211
-
212
-
213
-
214
-
215
-
216
-
217
-
218
-
219
-
220
-
221
-
222
-
223
-
224
-
225
-
226
-
227
-
228
-
229
-
230
-
231
-
232
-
233
-
234
-
235
-
236
-
237
-
238
-
239
-
240
-
241
-
242
-
243
-
244
-
245
-
246
-
247
-
248
-
249
-
250
-
251
-
252
-
253
-
254
-
255
-
256
-
257
-
258
-
259
-
260
-
261
-
262
-
263
-
264
-
265
-
266
-
267
-
268
-
269
-
270
-
271
-
272
-
273
-
274
-
275
-
276
-
277
-
278
-
279
-
280
-
281
-
282
-
283
-
284
-
285
-
286
-
287
-
288
-
289
-
290
-
291
-
292
-
293
-
294
-
295
-
296
-
297
-
298
-
299
-
300
-
301
-
302
-
303
-
304
-
305
-
306
-
307
-
308
-
309
-
310
-
311
-
312
-
313
-
314
-
315
-
316
-
317
-
318
-
319
-
320
-
321
-
322
-
323
-
324
-
325
-
326
-
327
-
328
-
329
-
330
-
331
-
332
-
333
-
334
-
335
-
336
-
337
-
338
-
339
-
340
-
341
-
342
-
343
-
344
-
345
-
346
-
347
-
348
-
349
-
350
-
351
-
352
-
353
-
354
-
355
-
356
-
357
-
358
-
359
-
360
-
361
-
362
-
363
-
364
-
365
-
366
-
367
-
368
-
369
-
370
-
371
-
372
-
373
-
374
-
375
-
376
-
377
-
378
-
379
-
380
-
381
-
382
-
383
-
384
-
385
-
386
-
387
-
388
-
389
-
390
-
391
-
392
-
393
-
394
-
395
-
396
-
397
-
398
-
399
-
400
-
401
-
402
-
403
-
404
-
405
-
406
-
407
-
408
-
409
-
410
-
411
-
412
-
413
-
414
-
415
-
416
-
417
-
418
-
419
-
420
-
421
-
422
-
423
-
424
-
425
-
426
-
427
-
428
-
429
-
430
-
431
-
432
-
433
-
434
-
435
-
436
-
437
-
438
-
439
-
440
-
441
-
442
-
443
-
444
-
445
-
446
-
447
-
448
-
449
-
450
-
451
-
452
-
453
-
454
-
455
-
456
-
457
-
458
-
459
-
460
-
461
-
462
-
463
-
464
-
465
-
466
-
467
-
468
-
469
-
470
-
471
-
472
-
473
-
474
-
475
-
476
-
477
-
478
-
479
-
480
-
481
-
482
-
483
-
484
-
485
-
486
-
487
-
488
-
489
-
490
-
491
-
492
-
493
-
494
-
495
-
496
-
497
-
498
-
499
-
500
-
501
-
502
-
503
-
504
-
505
-
506
-
507
-
508
-
509
-
510
-
511
-
512
-
513
-
514
-
515
-
516
-
517
-
518
-
519
-
520
-
521
-
522
-
523
-
524
-
525
-
526
-
527
-
528
-
529
-
530
-
531
-
532
-
533
-
534
-
535
-
536
-
537
-
538
-
539
-
540
-
541
-
542
-
543
-
544
-
545
-
546
-
547
-
548
-
549
-
550
-
551
-
552
-
553
-
554
-
555
-
556
-
557
-
558
-
559
-
560
-
561
-
562
-
563
-
564
-
565
-
566
-
567
-
568
-
569
-
570
-
571
-
572
-
573
-
574
-
575
-
576
-
577
-
578
-
579
-
580
-
581
-
582
-
583
-
584
-
585
-
586
-
587
-
588
-
589
-
590
-
591
-
592
-
593
-
594
-
595
-
596
-
597
-
598
-
599
-
600
-
601
-
602
-
603
-
604
-
605
-
606
-
607
-
608
-
609
-
610
-
611
-
612
-
613
-
614
-
615
-
616
-
617
-
618
-
619
-
620
-
621
-
622
-
623
-
624
-
625
-
626
-
627
-
628
-
629
-
630
-
631
-
632
-
633
-
634
-
635
-
636
-
637
-
638
-
639
-
640
-
641
-
642
-
643
-
644
-
645
-
646
-
647
-
648
-
649
-
650
-
651
-
652
-
653
-
654
-
655
-
656
-
657
-
658
-
659
-
660
-
661
-
662
-
663
-
664
-
665
-
666
-
667
-
668
-
669
-
670
-
671
-
672
-
673
-
674
-
675
-
676
-
677
-
678
-
679
-
680
-
681
-
682
-
683
-
684
-
685
-
686
-
687
-
688
-
689
-
690
-
691
-
692
-
693
-
694
-
695
-
696
-
697
-
698
-
699
-
700
-
701
-
702
-
703
-
704
-
705
-
706
-
707
-
708
-
709
-
710
-
711
-
712
-
713
-
714
-
715
-
716
-
717
-
718
-
719
-
720
-
721
-
722
-
723
-
724
-
725
-
726
-
727
-
728
-
729
-
730
-
731
-
732
-
733
-
734
-
735
-
736
-
737
-
 738
738 -
 739
739 -
 740
740 -
 741
741 -
 742
742 -
 743
743 -
 744
744 -
 745
745 -
 746
746 -
 747
747 -
 748
748 -
749
-
750
-
751
-
752
-
753
-
754
-
755
-
756
-
757
-
758
-
759
-
760
-
761
-
762
-
763
-
764
-
765
-
766
-
767
-
768
 |
 |