| Section |
Page |
| Legal notices |
2 |
| Contents |
3 |
| Chapter 1: Getting started |
7 |
| System requirements |
7 |
| Installing/uninstalling Adobe Photoshop Elements |
7 |
| Install from disc |
7 |
| Install downloaded software |
7 |
| Convert a trial version to a licensed (purchased) version |
7 |
| Can I have more than one version installed? |
7 |
| Uninstall Photoshop Elements |
8 |
| Creating an Adobe ID |
8 |
| Registering your software |
8 |
| Supported software and hardware |
8 |
| What’s new in Adobe Photoshop Elements 10 |
8 |
| Converting a catalog from a previous version |
8 |
| Show previously converted catalogs |
9 |
| Help resources |
9 |
| Welcome screen |
9 |
| Other getting started sources |
9 |
| Adobe Photoshop Elements Help |
9 |
| Help menu |
10 |
| Provide feedback on the product/post useful tips and tricks |
10 |
| Troubleshooting tips |
10 |
| Ask experts |
10 |
| Support for How-to questions |
11 |
| Customer support for product orders, installation, and activation |
11 |
| Elements Organizer and Photoshop Elements |
11 |
| Importing and organizing photos and video clips |
11 |
| Use the Photo Downloader to download files |
12 |
| Organizing your photos and video clips |
12 |
| Create a catalog |
13 |
| Create an album |
13 |
| Finding photos and video clips |
14 |
| Find the actual file of a photo or video clip |
14 |
| Creating photo projects |
15 |
| Create and share a slideshow (Windows only) |
15 |
| Fixing (editing) photos |
16 |
| Crop a photo |
16 |
| Resize a photo |
16 |
| Fix photos in the Organize workspace |
16 |
| Open photos in Full, Quick, or Guided editing modes |
16 |
| Making precise selections |
17 |
| Create photo effects with Guided Edits |
17 |
| Saving your edits |
18 |
| Printing and sharing photos |
18 |
| Print from Elements Organizer (Windows only) |
18 |
| Print online |
18 |
| Share photos using email |
19 |
| Back up/synchronize files |
19 |
| View Backup/Synchronization activity status |
20 |
| Start backup and synchronization activity manually |
21 |
| Chapter 2: Photoshop Elements workspace |
22 |
| About workspaces |
22 |
| The Welcome screen |
22 |
| The Edit workspace |
23 |
| Launch the Elements Inspiration Browser |
25 |
| Use context menus |
25 |
| Using keyboard commands and modifier keys |
25 |
| Exit Photoshop Elements |
25 |
| Tools |
26 |
| About the toolbox |
26 |
| Select a tool |
27 |
| Set Edit preferences |
28 |
| Set the appearance of a tool pointer |
28 |
| Resize or change the hardness of painting cursors by dragging |
28 |
| Set tool options |
29 |
| Set a completed operations alert |
29 |
| Panels and bins |
29 |
| About panels |
29 |
| Work with panels in the Edit worspace |
30 |
| Use the Project Bin in the Edit workspace |
32 |
| Multitouch support |
33 |
| Using Windows 7 features |
34 |
| Use Application frames on Mac |
34 |
| Undo, redo, and cancel |
35 |
| Undo, redo, or cancel operations |
35 |
| Using the Undo History panel while editing |
35 |
| Revert to the last saved version |
36 |
| Revert to a previous state of an image |
36 |
| Delete one or more states from the Undo History panel |
36 |
| Clear memory used by the clipboard and the Undo History panel |
36 |
| Restore default preferences |
37 |
| Redisplay disabled warning messages |
37 |
| Scratch disks and plug-ins |
37 |
| About scratch disks |
37 |
| Change scratch disks |
38 |
| About plug-in modules |
38 |
| Install plug-in modules |
38 |
| Select an additional plug-ins folder |
38 |
| Chapter 3: Working in Photoshop Elements |
40 |
| Opening files in the Edit workspace |
40 |
| Create a new blank file |
40 |
| Open a file |
40 |
| Open a file in an Application Frame (Mac OS) |
41 |
| Open a recently used file |
41 |
| Specify the file format in which to open a file |
41 |
| Open a PDF file |
41 |
| Open an EPS file |
42 |
| Place a PDF, Adobe Illustrator, or EPS file in a new layer |
43 |
| Process multiple files |
44 |
| Close a file |
45 |
| Importing in the Edit workspace |
45 |
| Import frames from video |
45 |
| Import images from a digital camera using WIA (Windows only) |
45 |
| File information |
46 |
| About file information (metadata) |
46 |
| View or add file information in the Edit workspace |
46 |
| Use the Info panel in the Edit workspace |
47 |
| Set color modes and units of measurement in the Info panel |
47 |
| Display file information in the Info panel or status bar |
48 |
| Save or delete metadata templates in the Edit workspace |
48 |
| Use a saved metadata template in the Edit workspace |
48 |
| Viewing images in the Edit workspace |
49 |
| Viewing images in Full Edit or Quick Fix |
49 |
| Zoom in or out |
49 |
| Display an image at 100% |
50 |
| Fit an image to the screen |
50 |
| Resize the window while zooming |
50 |
| Using the Navigator panel |
51 |
| Open multiple windows of the same image |
51 |
| View and arrange multiple windows |
51 |
| Close windows |
52 |
| Guides, grids, and rulers |
52 |
| About rulers, grids, and guides |
52 |
| Change the rulers’ zero origin and settings |
52 |
| Change the grid settings |
53 |
| Change the guide settings |
53 |
| Saving and exporting images |
53 |
| About saving images and file formats |
53 |
| File formats for saving |
54 |
| Save changes in different file formats |
55 |
| Change file-saving options |
55 |
| Save a file in GIF format |
56 |
| Save a file in JPEG format |
56 |
| Save a file in Photoshop EPS format |
57 |
| Save a file in Photoshop PDF format |
57 |
| Save a file in PNG format |
57 |
| Save a file in TIFF format |
58 |
| Understanding file compression |
58 |
| Set file-saving preferences |
58 |
| Guided Edit |
59 |
| Use the Guided Edit options |
60 |
| The Crop Photo Guided Edit |
60 |
| The Recompose Photo Guided Edit |
60 |
| The Rotate And/Or Straighten Guided Edit |
60 |
| The Sharpen Photo Guided Edit |
60 |
| The Lighten Or Darken Guided Edit |
60 |
| The Brightness And Contrast Guided Edit |
61 |
| The Adjust Levels Guided Edit |
61 |
| The Enhance Colors Guided Edit |
61 |
| Adding custom content |
61 |
| The Remove A Color Cast Guided Edit |
61 |
| The Correct Skin Tone Guided Edit |
61 |
| The Touch Up Photo Guided Edit |
61 |
| The “Guide For Editing A Photo” Guided Edit |
62 |
| The Fix Keystone Distortion Guided Edit |
62 |
| The Photomerge Group Shot Guided Edit |
62 |
| The Photomerge Faces Guided Edit |
62 |
| The Photomerge Scene Cleaner Guided Edit |
62 |
| The Photomerge Exposure Guided Edit |
62 |
| The Photomerge Style Match Guided Edit |
62 |
| The Automated Action Player Guided Edit |
62 |
| Install actions created in Photoshop |
63 |
| The Line Drawing Guided Edit |
63 |
| Add a Lomo camera effect |
63 |
| The Old Fashioned Photo Guided Edit |
63 |
| The Saturated Slide Film Effect Guided Edit |
63 |
| Depth of Field effect |
63 |
| Simple method |
63 |
| Custom method |
64 |
| Create an Out of Bounds effect |
64 |
| Split an image into multiple snapshots |
65 |
| Apply the Orton Effect |
65 |
| Create a perfect portrait |
65 |
| Transform an image into pop art |
66 |
| Add a reflection |
66 |
| Chapter 4: Using layers |
68 |
| Creating layers |
68 |
| Understanding layers |
68 |
| About the Layers panel |
69 |
| Adding layers |
70 |
| Create and name a new blank layer |
71 |
| Create a new layer from part of another layer |
71 |
| Convert the Background layer into a regular layer |
72 |
| Make a layer the Background layer |
72 |
| Editing layers |
72 |
| Select a layer |
72 |
| Show or hide a layer |
73 |
| Resize or hide layer thumbnails |
73 |
| Lock or unlock a layer |
73 |
| Rename a layer |
73 |
| Simplify a layer |
74 |
| Delete a layer |
74 |
| Sample color from all visible layers |
74 |
| Copying and arranging layers |
75 |
| Duplicate a layer within an image |
75 |
| Duplicate one or more layers in another image |
75 |
| Copy a layer from one image to another |
76 |
| Move the content in a layer |
77 |
| Change the stacking order of layers |
77 |
| Link and unlink layers |
78 |
| Merge layers |
78 |
| Merge layers into another layer |
79 |
| Flatten an image |
80 |
| Opacity and blending modes |
80 |
| About opacity and blending options in layers |
80 |
| Specify the opacity of a layer |
81 |
| Specify a blending mode for a layer |
81 |
| Select all opaque areas in a layer |
81 |
| Customize the transparency grid |
82 |
| Adjustment and fill layers |
82 |
| About adjustment and fill layers |
82 |
| Create adjustment layers |
83 |
| Create fill layers |
84 |
| Edit an adjustment or fill layer |
84 |
| Merging adjustment layers |
85 |
| Edit the layer masks |
85 |
| Layer masks |
86 |
| About layer masks |
86 |
| Add a layer mask to an image |
86 |
| Clipping masks |
86 |
| About layer clipping masks |
86 |
| Create a clipping mask |
87 |
| Remove a layer from a clipping mask |
87 |
| Release clipping mask |
88 |
| Layer styles |
88 |
| About layer styles |
88 |
| Work with layer styles |
89 |
| Apply a layer style |
89 |
| Hide or show all layer styles in an image |
90 |
| Edit a layer’s style settings |
90 |
| Change the scale of a layer style |
90 |
| Copy style settings between layers |
90 |
| Remove a layer style |
90 |
| Chapter 5: Camera raw files |
91 |
| Processing camera raw image files |
91 |
| About camera raw image files |
91 |
| Open and process camera raw files |
92 |
| Adjust sharpness in camera raw files |
92 |
| Reducing noise in camera raw images |
93 |
| Save changes to camera raw images |
93 |
| Open a camera raw image in the Edit workspace |
94 |
| Settings and controls |
94 |
| Camera raw controls |
94 |
| Set custom camera settings |
94 |
| Color and camera raw |
95 |
| Using the histogram and RGB values in camera raw |
95 |
| White balance controls for camera raw |
95 |
| Tonal and image adjustments in camera raw files |
96 |
| Chapter 6: Selecting parts of an image |
99 |
| Making selections |
99 |
| About selections |
99 |
| About the selection tools |
100 |
| Use the Rectangular and Elliptical Marquee tools |
100 |
| Use the Lasso tool |
101 |
| Use the Polygonal Lasso tool |
101 |
| Use the Magnetic Lasso tool |
102 |
| Use the Magic Wand tool |
103 |
| Use the Quick Selection tool |
104 |
| Use the Selection Brush tool |
105 |
| Use the Magic Extractor |
106 |
| Delete a selected area |
107 |
| Select and deselect areas using commands |
108 |
| Modifying selections |
108 |
| Move a selection border |
108 |
| Invert a selection |
108 |
| Add to or subtract from a selection |
109 |
| Select an area that intersects an existing selection |
109 |
| Expand or contract a selection by a specific number of pixels |
109 |
| Frame an existing selection with a new selection border |
110 |
| Include areas of similar color in a selection |
110 |
| Remove stray pixels from a color-based selection |
111 |
| Defringe a selection |
111 |
| Smoothing selection edges with anti-aliasing and feathering |
112 |
| Smooth the edges of a selection by anti-aliasing |
112 |
| Blur the edges of a selection by feathering |
112 |
| Define a feathered edge for a selection tool |
112 |
| Define a feathered edge for an existing selection |
112 |
| Moving and copying selections |
113 |
| Move a selection |
113 |
| Move tool options |
113 |
| Copying selections or layers |
114 |
| Copy selections with the Move tool |
114 |
| Copy a selection using commands |
114 |
| Paste one selection into another |
114 |
| Saving selections |
115 |
| Save, load, or delete a selection |
115 |
| Modify a saved selection |
116 |
| Modify a new selection with a saved selection |
117 |
| Chapter 7: Color and tonal correction |
118 |
| Color and tonal correction basics |
118 |
| Color correction overview |
118 |
| Correct color in Quick Fix |
118 |
| Quick Fix preview |
119 |
| Fix photos with Touch Up buttons in the Quick Fix Tools panel |
121 |
| Quick Fix and Edit workspace options |
121 |
| Correcting color in Full Edit |
122 |
| Automatically correct lighting and color |
124 |
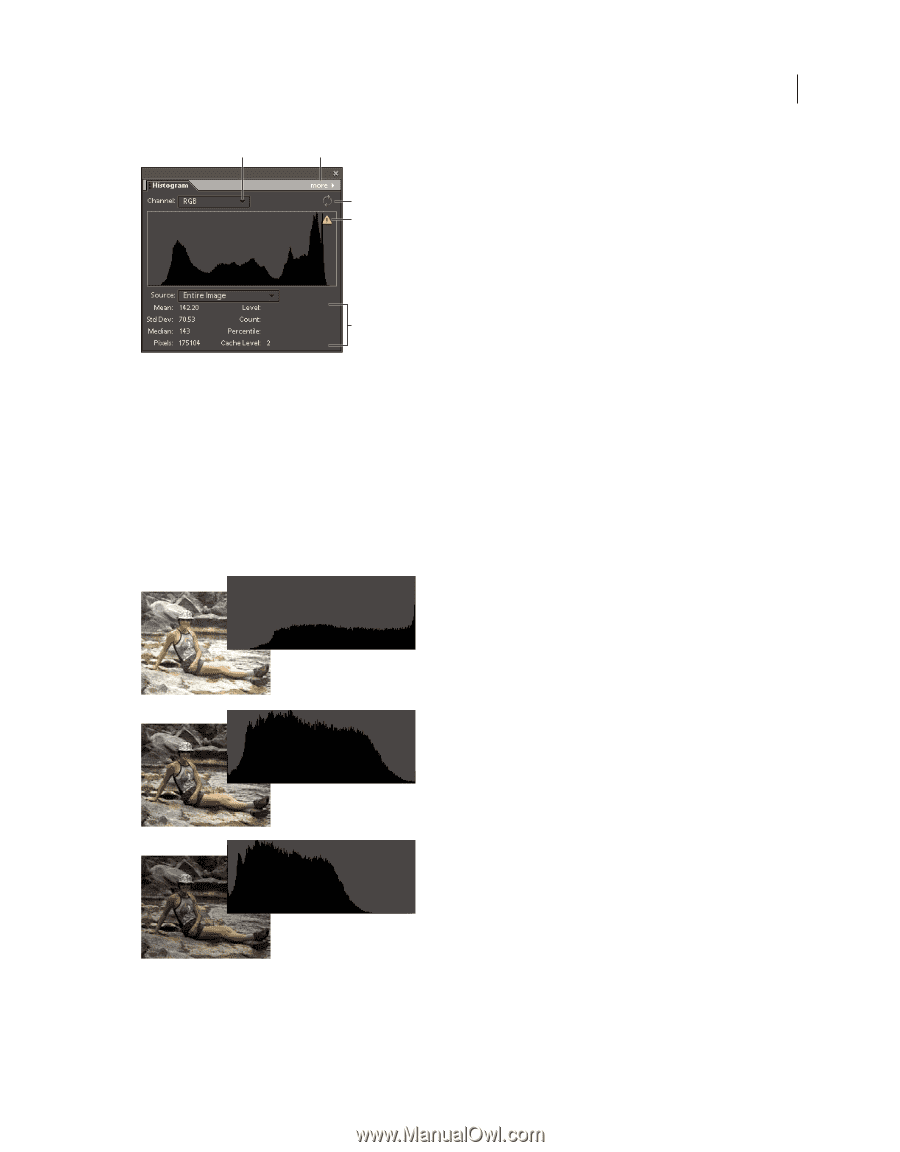
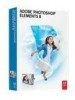
| About histograms |
124 |
| View a histogram |
126 |
| Adjusting shadows and light |
127 |
| Adjust color and tonality using the Smart Brush tools |
127 |
| Apply the Smart Brush tools |
130 |
| Modify Smart Brush tool correction settings |
131 |
| Change the Smart Brush tool correction preset |
131 |
| Delete a Smart Brush tool correction |
131 |
| Smart Brush pop-up panel |
131 |
| About Levels adjustments |
131 |
| Improve shadow and highlight detail |
132 |
| Adjust shadows and brightness using Levels |
133 |
| Adjust brightness and contrast in selected areas |
134 |
| Quickly lighten or darken isolated areas |
135 |
| Quickly saturate or desaturate isolated areas |
136 |
| Correcting color casts |
136 |
| Correct color casts by comparing variations of an image |
136 |
| Remove a color cast automatically |
138 |
| Remove a color cast using Levels |
138 |
| Adjust color curves |
139 |
| Adjusting color saturation and hue |
140 |
| Adjust saturation and hue |
140 |
| Change color saturation or hue |
140 |
| Modify the range of Hue/Saturation sliders |
141 |
| Adjust the color of skin tone |
142 |
| Adjust saturation in isolated areas |
143 |
| Change the color of an object |
143 |
| Precisely convert to black and white |
144 |
| Automatically convert to black and white |
145 |
| Add custom presets for black and white conversion |
145 |
| Add color to a grayscale image |
145 |
| Adjustment filters |
146 |
| Apply the Equalize filter |
146 |
| Apply the Gradient Map filter |
146 |
| Apply the Invert filter |
147 |
| Apply the Posterize filter |
147 |
| Apply the Threshold filter |
148 |
| Apply the Photo filter |
149 |
| Chapter 8: Crop an image�Cropping, resizing, retouching, and transforming photos |
151 |
| Cropping |
151 |
| Crop an image |
151 |
| Crop to a selection boundary |
152 |
| Using guides for better cropping results |
153 |
| Use the Cookie Cutter tool |
153 |
| Change the size of the canvas |
154 |
| Straighten an image |
155 |
| Manually straighten an image |
155 |
| Automatically straighten an image |
156 |
| Divide a scanned image containing multiple photos |
156 |
| Resizing |
157 |
| About image size and resolution |
157 |
| About monitor resolution |
158 |
| Display the image size of an open file |
159 |
| View the print size on-screen |
159 |
| Change print dimensions and resolution without resampling |
159 |
| Resample an image |
159 |
| Retouching |
161 |
| Precisely remove red eye |
161 |
| Remove spots and unwanted objects |
162 |
| Remove spots and small imperfections |
162 |
| Remove unwanted objects with content-aware healing |
162 |
| Fix large imperfections |
163 |
| Clone images or areas in an image |
164 |
| Replace colors in an image |
166 |
| Blur or soften edges |
166 |
| Correct camera distortion |
167 |
| Use Photomerge Group Shot |
169 |
| Use Photomerge Faces |
170 |
| Use Photomerge Scene Cleaner |
171 |
| Photomerge Exposure |
173 |
| Automatic Photomerge Exposure |
174 |
| Manual Photomerge Exposure |
175 |
| Photomerge Style Match |
175 |
| Sharpening |
177 |
| Sharpening overview |
177 |
| Sharpen an image |
178 |
| Automatically sharpen an image |
178 |
| Sharpen areas of an image |
178 |
| Precisely sharpen an image |
179 |
| Use the Unsharp Mask filter |
179 |
| Transforming |
180 |
| Rotate or flip an item |
180 |
| Freely rotate an item |
181 |
| Scale an item |
182 |
| Skew or distort an item |
182 |
| Apply perspective to an item |
183 |
| Freely transform an item |
183 |
| Apply a transformation to a Background layer |
184 |
| Recomposing |
184 |
| Recompose a photo in Guided Edit |
185 |
| Recompose a photo in Full Edit |
186 |
| Recompose a photo in a photo project |
187 |
| Recompose options |
187 |
| Stitching together panoramas |
188 |
| Creating photomerge panoramas |
188 |
| Create a Photomerge panorama composition |
189 |
| Create a Photomerge panorama interactively |
190 |
| The Photomerge dialog box for interactive layouts |
190 |
| Change the vanishing point in a Photomerge panorama |
191 |
| Chapter 9: Understanding color |
192 |
| Understanding color |
192 |
| About color |
192 |
| HSB model |
192 |
| RGB model |
193 |
| Color wheel |
193 |
| Using image modes and color tables |
194 |
| About image modes |
194 |
| Convert an image to bitmap mode |
195 |
| Convert a bitmap-mode image to grayscale |
196 |
| Convert an image to indexed color |
196 |
| Edit colors in an indexed-color table |
198 |
| Assign transparency to a single color in an indexed-color table |
198 |
| Use a predefined indexed-color table |
198 |
| Save or load an indexed-color table |
198 |
| Setting up color management |
199 |
| About color management |
199 |
| Profiling devices |
200 |
| Color management tasks |
200 |
| Set up color management |
200 |
| Convert color profile |
201 |
| Chapter 10: Filters, effects, styles, and artwork |
202 |
| Effects |
202 |
| Using the Effects panel |
202 |
| Using the Content panel |
202 |
| Add stylized shapes or graphics to an image |
203 |
| Add an artistic background to an image |
204 |
| Add a frame or theme to an image |
204 |
| About photo effects |
204 |
| Apply an effect |
205 |
| Add stylized text to an image |
206 |
| Add artwork or effects to Favorites |
206 |
| Filters |
206 |
| About filters |
206 |
| Apply a filter |
208 |
| Filter categories |
209 |
| Filter Gallery |
210 |
| Texture and glass surface options |
211 |
| Improve performance with filters and effects |
211 |
| Artistic filters |
211 |
| Colored Pencil |
211 |
| Cutout |
212 |
| Dry Brush |
212 |
| Film Grain |
212 |
| Fresco |
212 |
| Neon Glow |
212 |
| Paint Daubs |
212 |
| Palette Knife |
212 |
| Plastic Wrap |
212 |
| Poster Edges |
212 |
| Rough Pastels |
213 |
| Smudge Stick |
213 |
| Sponge |
213 |
| Underpainting |
213 |
| Watercolor |
213 |
| Blur filters |
213 |
| Average |
213 |
| Blur and Blur More |
213 |
| Gaussian Blur |
214 |
| Motion Blur |
214 |
| Radial Blur |
214 |
| Smart Blur |
214 |
| Surface Blur |
214 |
| Brush Stroke filters |
215 |
| Accented Edges |
215 |
| Angled Strokes |
215 |
| Crosshatch |
215 |
| Dark Strokes |
215 |
| Ink Outlines |
215 |
| Spatter |
215 |
| Sprayed Strokes |
215 |
| Sumi-e |
215 |
| Distort filters |
216 |
| Diffuse Glow |
216 |
| Displace |
216 |
| Apply the Displace filter |
216 |
| Glass |
216 |
| Liquify |
217 |
| Apply the Liquify filter |
217 |
| Ocean Ripple |
218 |
| Pinch |
218 |
| Apply the Pinch filter |
218 |
| Polar Coordinates |
218 |
| Ripple |
218 |
| Shear |
218 |
| Apply the Shear filter |
219 |
| Spherize |
219 |
| Apply the Spherize filter |
219 |
| Twirl |
219 |
| Wave |
219 |
| Apply the Wave filter |
219 |
| ZigZag |
220 |
| Apply the ZigZag filter |
220 |
| Noise filters |
220 |
| Add Noise |
220 |
| Despeckle |
221 |
| Dust & Scratches |
221 |
| Median |
221 |
| Reduce Noise |
221 |
| Pixelate filters |
221 |
| Color Halftone |
221 |
| Apply the Color Halftone filter |
221 |
| Crystalize |
222 |
| Facet |
222 |
| Fragment |
222 |
| Mezzotint |
222 |
| Mosaic |
222 |
| Pointillize |
222 |
| Render filters |
222 |
| Clouds |
222 |
| Difference Clouds |
223 |
| Fibers |
223 |
| Lens Flare |
223 |
| Lighting Effects |
223 |
| Apply the Lighting Effects filter |
223 |
| Adjust a light |
225 |
| Texture Fill |
225 |
| Sketch filters |
225 |
| Bas Relief |
225 |
| Chalk & Charcoal |
225 |
| Charcoal |
225 |
| Chrome |
225 |
| Conté Crayon |
226 |
| Graphic Pen |
226 |
| Halftone Pattern |
226 |
| Note Paper |
226 |
| Photocopy |
226 |
| Plaster |
226 |
| Reticulation |
226 |
| Stamp |
227 |
| Torn Edges |
227 |
| Water Paper |
227 |
| Stylize filters |
227 |
| Diffuse |
227 |
| Emboss |
227 |
| Extrude |
227 |
| Apply the Extrude filter |
227 |
| Find Edges |
228 |
| Glowing Edges |
228 |
| Solarize |
228 |
| Tiles |
228 |
| Trace Contour |
228 |
| Wind |
228 |
| Texture filters |
229 |
| Craquelure |
229 |
| Grain |
229 |
| Mosaic Tiles |
229 |
| Patchwork |
229 |
| Stained Glass |
229 |
| Texturizer |
229 |
| Video filters |
229 |
| De-Interlace |
229 |
| NTSC Colors |
229 |
| Other filters |
230 |
| Custom filters |
230 |
| Apply a Custom filter |
230 |
| High Pass |
230 |
| Maximum and Minimum |
231 |
| Offset |
231 |
| Plug-in filters |
231 |
| Digimarc filter |
231 |
| Detect the Digimarc filter |
231 |
| Chapter 11: Painting |
232 |
| Painting overview |
232 |
| About painting tools |
232 |
| About foreground and background colors |
233 |
| About blending modes |
233 |
| Web-safe colors |
236 |
| Choosing colors |
236 |
| Choose a color with the Eyedropper tool |
236 |
| Choose a color from the toolbox |
237 |
| Use the Color Swatches panel |
238 |
| Choose a color using the Color Swatches panel |
238 |
| Add a color to the Color Swatches panel |
238 |
| Save and use custom swatch libraries |
239 |
| Reset a swatch library to its default color swatches |
239 |
| Delete a color from the Color Swatches panel |
239 |
| Use the Adobe Color Picker |
239 |
| Painting tools |
240 |
| Use the Brush tool |
240 |
| Use the Pencil tool |
241 |
| Use the Impressionist Brush tool |
242 |
| Use the Smudge tool |
243 |
| Use the Eraser tool |
244 |
| Use the Magic Eraser tool |
244 |
| Use the Background Eraser tool |
246 |
| Setting up brushes |
247 |
| About brush options |
247 |
| Add a new brush to the brush library |
249 |
| Delete a brush |
249 |
| Create a custom brush shape from an image |
249 |
| Set up pressure-sensitive tablet support |
250 |
| Using Elements Organizer on Wacom tablets |
250 |
| Switch between mouse and pen mode |
251 |
| Fills and strokes |
251 |
| Use the Paint Bucket tool |
251 |
| Fill a layer with a color or pattern |
252 |
| Stroke (outline) objects on a layer |
252 |
| Patterns |
253 |
| About patterns |
253 |
| Use the Pattern Stamp tool |
254 |
| Add a custom pattern to the pattern picker |
254 |
| Use a preset pattern from the PostScript Patterns folder |
254 |
| Gradients |
255 |
| About gradients |
255 |
| Apply a gradient |
256 |
| Apply gradient fill to text |
256 |
| Define a gradient |
257 |
| Specify gradient transparency |
257 |
| Create a noise gradient |
258 |
| Presets and libraries |
259 |
| About presets |
259 |
| Use preset tool options |
259 |
| Change the display of items in a pop-up panel menu |
260 |
| Use the Preset Manager |
260 |
| Load a library |
261 |
| Restore the default library or replace the currently displayed library |
261 |
| Save a subset of a library |
261 |
| Rename a preset |
261 |
| Chapter 12: Adding text and shapes |
262 |
| Add and edit text |
262 |
| About text |
262 |
| Add text |
262 |
| Type tool options |
263 |
| Edit type in a type layer |
264 |
| Align text |
264 |
| Select characters |
264 |
| Choose a font family and style |
265 |
| Choose a font size |
265 |
| Change text color |
266 |
| Adding Text to Images |
266 |
| Text on Selection |
266 |
| Text on Shape |
268 |
| Text on Custom Path |
268 |
| Create and use masked type |
270 |
| Warp type |
271 |
| Unwarp type |
271 |
| Change the orientation of a type layer |
271 |
| Work with Asian type |
272 |
| Display Asian type options |
272 |
| Reduce spacing between Asian characters |
272 |
| Turn on or turn off tate-chuu-yoko |
272 |
| Turn on or turn off mojikumi |
273 |
| Creating shapes |
273 |
| About shapes |
273 |
| Draw a rectangle, square, or rounded rectangle |
274 |
| Draw a circle or ellipse |
274 |
| Draw a multisided shape |
275 |
| Draw a line or arrow |
275 |
| Draw a custom shape |
276 |
| Create multiple shapes in the same layer |
276 |
| Editing shapes |
277 |
| Select or move a shape |
277 |
| Transform a shape |
277 |
| Change the color of all shapes in a layer |
277 |
| Apply a layer style to a shape |
277 |
| Chapter 13: Creating projects in the Edit workspace |
279 |
| Project basics |
279 |
| Making photo projects |
279 |
| About photo projects |
279 |
| Synchronize photo projects |
280 |
| Setting photo project options |
280 |
| Types of photo projects |
281 |
| About photo collages |
281 |
| About greeting cards |
281 |
| About CD and DVD jackets |
281 |
| About CD and DVD labels |
282 |
| About slide shows |
282 |
| Make a photo collage, label, CD, and DVD Jacket |
283 |
| Create a photo book |
283 |
| Create a photo book |
284 |
| Create photo books using Shutterfly |
284 |
| Create photo books using Kodak Gallery |
285 |
| Create a greeting card |
285 |
| Create a greeting card and print on a local printer |
286 |
| Order greeting cards using Shutterfly |
286 |
| Order greeting cards using Kodak Gallery |
287 |
| Create photo calendars |
288 |
| Create photo calendars for local printing |
288 |
| Create photo calendars and order using Kodak Gallery |
288 |
| Editing photo projects |
289 |
| About photo project edits |
289 |
| Add images to a photo project |
289 |
| Edit photos in the Quick Fix mode |
289 |
| Add new pages to a photo project |
290 |
| Reposition or resize photos in a photo project |
290 |
| Replace or remove photos in a photo project |
290 |
| Rotate photos in a photo project |
291 |
| Edit photo project pages in Photoshop CS5 |
291 |
| Create a VCD with a menu of slide shows |
292 |
| Flipbooks |
292 |
| Chapter 14: Optimizing for the web |
293 |
| Optimizing images |
293 |
| About optimizing |
293 |
| Using the Save For Web dialog box |
293 |
| Optimized file formats for the web |
294 |
| About the JPEG format |
295 |
| About the GIF format |
296 |
| About the PNG-8 format |
296 |
| About the PNG-24 format |
297 |
| About animated GIFs |
297 |
| Apply a preset optimization setting |
298 |
| Optimize as JPEG |
298 |
| Optimize as GIF or PNG-8 format |
299 |
| Optimize as PNG-24 |
300 |
| Create an animated GIF |
300 |
| Using transparency and mattes |
301 |
| About transparent and matted web images |
301 |
| Preserve background transparency in a GIF or PNG image |
302 |
| Create a matted GIF or PNG image |
302 |
| Create hard-edged transparency in a GIF or PNG-8 file |
303 |
| Create a matted JPEG image |
303 |
| Dithering in web images |
303 |
| About dithering |
303 |
| Control dither in web images |
304 |
| Preview dither |
304 |
| Previewing web images |
305 |
| Preview an optimized image in a web browser |
305 |
| Add a browser to the Preview In menu |
305 |
| View estimated download time |
305 |
| Preview variations in color display |
306 |
| Preview an animation |
306 |
| Chapter 15: Printing and sharing photos |
307 |
| Printing photos |
307 |
| Printing overview |
307 |
| Print photos from the Edit workspace |
308 |
| Add photos using the Print dialog box |
309 |
| Image and Photoholder rotation |
310 |
| More options for printing from the Edit workspace |
312 |
| Scale an image in the Print dialog box |
313 |
| Print multilayer images from the Edit workspace |
313 |
| Use Photo Prints |
313 |
| Print a contact sheet |
314 |
| Print a picture package |
314 |
| Print options |
314 |
| Set page and printer options |
314 |
| Send photos to online sharing services |
315 |
| Sharing photos |
315 |
| Chapter 16: Photoshop Elements keyboard shortcuts |
316 |
| Windows 7 keyboard shortcuts |
316 |
| Keys for viewing images (Full Edit) |
316 |
| Keys for selecting tools |
317 |
| Keys for selecting and moving objects |
319 |
| Keys for the Magic Extractor dialog box |
320 |
| Keys for transforming selections |
320 |
| Keys for painting and brushes |
320 |
| Keys for using text |
321 |
| Keys for the Layers panel |
322 |
| Keys for using blending modes |
323 |
| Keys for the Info panel |
324 |
| Keys for the Color Swatches panel |
324 |
| Keys for showing or hiding panels (Full Edit) |
324 |
| Keys for the Filter Gallery |
324 |
| Keys for the Liquify filter |
325 |
| Keys for using Photomerge Panorama |
325 |
| Keys for the Camera Raw dialog box |
326 |
| Chapter 17: Glossary |
327 |
| Find definitions for terms |
327 |
| Digital imaging terms |
327 |
| A |
327 |
| B |
328 |
| C |
329 |
| D |
331 |
| E |
331 |
| F |
332 |
| G |
333 |
| H |
333 |
| I |
333 |
| J |
334 |
| K |
334 |
| L |
334 |
| M |
335 |
| N |
335 |
| O |
335 |
| P |
336 |
| Q |
337 |
| R |
337 |
| S |
338 |
| T |
339 |
| U |
340 |
| V |
340 |
| W |
341 |
 1
1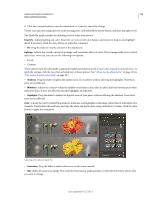 120
120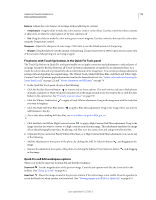 121
121 122
122 123
123 124
124 125
125 126
126 127
127 128
128 129
129 130
130