HP StorageWorks 2/16V Brocade Fabric Manager Administrator's Guide (53-1000019 - Page 116
Identifying Alerts, To view alerts for switch groups
 |
View all HP StorageWorks 2/16V manuals
Add to My Manuals
Save this manual to your list of manuals |
Page 116 highlights
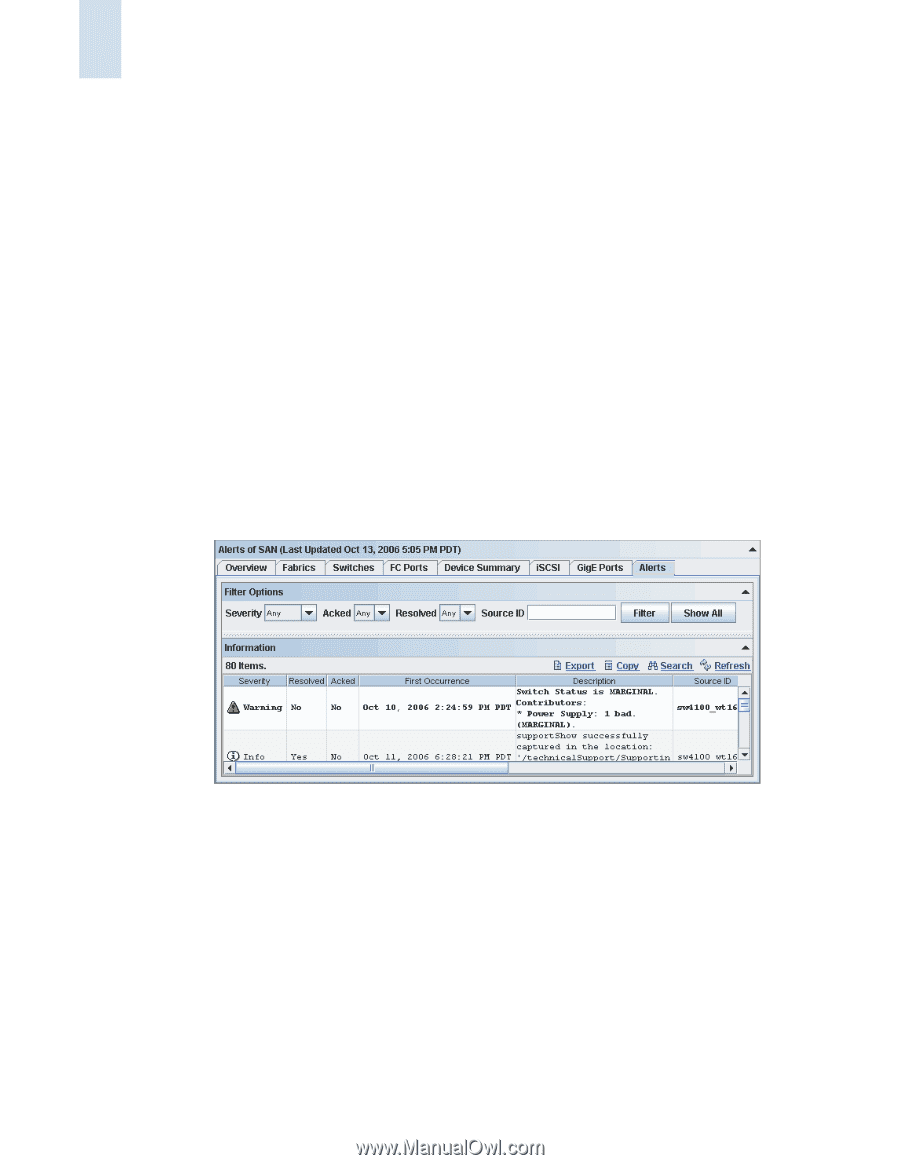
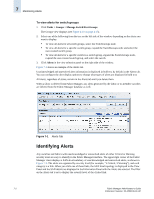
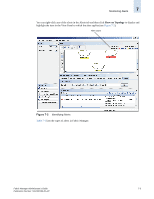
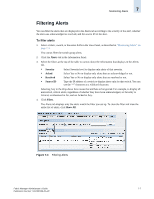
7 Monitoring Alerts To view alerts for switch groups 1. Click Tasks > Groups > Manage Switch/Port Groups. The Groups view displays (see Figure 4-10 on page 4-15). 2. Select one of the following from the tree on the left side of the window, depending on the alerts you want to display: • To view all alerts for all switch groups, select the SwitchGroups node. • To view all alerts for a specific switch group, expand the SwitchGroups node and select the user-created switch group. • To view all alerts for a specific switch in a switch group, expand the SwitchGroups node, expand the user-created switch group, and select the switch. 3. Click Alerts in the view selection panel on the right side of the window. Figure 7-1 shows an example of the Alerts tab. Unacknowledged and unresolved alert information is displayed in bold text by default in the Alerts tab. You can configure the alert display options to change what types of alerts are displayed in bold text. All alerts, regardless of status, remain in the Alerts tab until you delete them. When a fabric is deleted from Fabric Manager, any alerts generated by the fabric or its member switches are deleted from the Fabric Manager database as well. Figure 7-1 Alerts Tab Identifying Alerts Any switches and fabrics with unacknowledged or unresolved alerts of either Critical or Warning severity level are easy to identify in the Fabric Manager interface. The upper right corner of the Fabric Manager client displays a SAN-level summary of unacknowledged and unresolved alerts, as shown in Figure 7-2. The alerts are organized by severity level (for example, "1 Critical, 3 Warning"), and each category is a link. When you click one of these links, the SAN level topology is displayed in the View Panel and the SAN details are displayed in the Information Panel with the Alerts tab selected. The filter on the Alerts tab is set to display the severity level of the clicked link. 7-2 Fabric Manager Administrator's Guide Publication Number: 53-1000196-01-HP
-
 1
1 -
2
-
3
-
4
-
5
-
6
-
7
-
8
-
9
-
10
-
11
-
12
-
13
-
14
-
15
-
16
-
17
-
18
-
19
-
20
-
21
-
22
-
23
-
24
-
25
-
26
-
27
-
28
-
29
-
30
-
31
-
32
-
33
-
34
-
35
-
36
-
37
-
38
-
39
-
40
-
41
-
42
-
43
-
44
-
45
-
46
-
47
-
48
-
49
-
50
-
51
-
52
-
53
-
54
-
55
-
56
-
57
-
58
-
59
-
60
-
61
-
62
-
63
-
64
-
65
-
66
-
67
-
68
-
69
-
70
-
71
-
72
-
73
-
74
-
75
-
76
-
77
-
78
-
79
-
80
-
81
-
82
-
83
-
84
-
85
-
86
-
87
-
88
-
89
-
90
-
91
-
92
-
93
-
94
-
95
-
96
-
97
-
98
-
99
-
100
-
101
-
102
-
103
-
104
-
105
-
106
-
107
-
108
-
109
-
110
-
 111
111 -
 112
112 -
 113
113 -
 114
114 -
 115
115 -
 116
116 -
 117
117 -
 118
118 -
 119
119 -
 120
120 -
 121
121 -
122
-
123
-
124
-
125
-
126
-
127
-
128
-
129
-
130
-
131
-
132
-
133
-
134
-
135
-
136
-
137
-
138
-
139
-
140
-
141
-
142
-
143
-
144
-
145
-
146
-
147
-
148
-
149
-
150
-
151
-
152
-
153
-
154
-
155
-
156
-
157
-
158
-
159
-
160
-
161
-
162
-
163
-
164
-
165
-
166
-
167
-
168
-
169
-
170
-
171
-
172
-
173
-
174
-
175
-
176
-
177
-
178
-
179
-
180
-
181
-
182
-
183
-
184
-
185
-
186
-
187
-
188
-
189
-
190
-
191
-
192
-
193
-
194
-
195
-
196
-
197
-
198
-
199
-
200
-
201
-
202
-
203
-
204
-
205
-
206
-
207
-
208
-
209
-
210
-
211
-
212
-
213
-
214
-
215
-
216
-
217
-
218
-
219
-
220
-
221
-
222
-
223
-
224
-
225
-
226
-
227
-
228
-
229
-
230
-
231
-
232
-
233
-
234
-
235
-
236
-
237
-
238
-
239
-
240
-
241
-
242
-
243
-
244
-
245
-
246
-
247
-
248
-
249
-
250
-
251
-
252
-
253
-
254
-
255
-
256
-
257
-
258
-
259
-
260
-
261
-
262
-
263
-
264
-
265
-
266
-
267
-
268
-
269
-
270
-
271
-
272
-
273
-
274
-
275
-
276
-
277
-
278
-
279
-
280
-
281
-
282
-
283
-
284
-
285
-
286
-
287
-
288
-
289
-
290
-
291
-
292
-
293
-
294
-
295
-
296
-
297
-
298
-
299
-
300
-
301
-
302
-
303
-
304
-
305
-
306
-
307
-
308
-
309
-
310
-
311
-
312
-
313
-
314
-
315
-
316
-
317
-
318
-
319
-
320
-
321
-
322
-
323
-
324
-
325
-
326
-
327
-
328
-
329
-
330
-
331
-
332
-
333
-
334
-
335
-
336
-
337
-
338
-
339
-
340
-
341
-
342
-
343
-
344
-
345
-
346
-
347
-
348
-
349
-
350
-
351
-
352
-
353
-
354
-
355
-
356
-
357
-
358
-
359
-
360
-
361
-
362
-
363
-
364
-
365
-
366
-
367
-
368
-
369
-
370
-
371
-
372
-
373
-
374
-
375
-
376
-
377
-
378
-
379
-
380
-
381
-
382
-
383
-
384
-
385
-
386
-
387
-
388
-
389
-
390
-
391
-
392
-
393
-
394
-
395
-
396
-
397
-
398
-
399
-
400
-
401
-
402
-
403
-
404
-
405
-
406
 |
 |