HP StorageWorks 2/16V Brocade Fabric Manager Administrator's Guide (53-1000019 - Page 133
Enabling Performance Monitoring
 |
View all HP StorageWorks 2/16V manuals
Add to My Manuals
Save this manual to your list of manuals |
Page 133 highlights
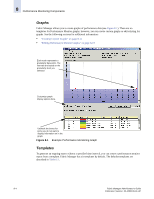
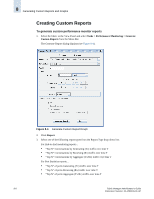
Enabling Performance Monitoring 8 Table 8-2 Default Performance Monitoring Report Templates for Port Statistics Report Name Format Time Granularity Filter "Top N" of Ports (Aggregate Tx/Rx Traffic) over Display Last 1 hour 5 minutes time T (HTML) None "Top N" of Ports (Aggregate Tx/Rx Traffic) over Display Last 30 time T (HTML) minutes 5 minutes None "Top N" of Ports Receiving (Rx) traffic over time T Display Last 1 hour 5 minutes (HTML) None "Top N" of Ports Receiving (Rx) traffic over time T Display Last 30 (HTML) minutes 5 minutes None "Top N" of Ports Generating (Tx) traffic over time Display Last 1 hour 5 minutes (HTML) None "Top N" of Ports Generating (Tx) traffic over time Display Last 30 (HTML) minutes 5 minutes None You can create and save additional templates. For more information, see "Creating Templates for Reports and Graphs" on page 8-14. Enabling Performance Monitoring Using the performance monitoring feature, you can collect information about the traffic generated between ports (end-to-end) and/or the receive/transmit traffic on individual switch ports. The performance monitor data is not stored on the Fabric Manager database during periods when the feature is not enabled. Note Performance monitor is designed to be enabled at all times. Its benefits are diminished if the historical data is not available to you when you need it. Before you can enable performance monitoring, you must be logged in to the seed switch of the fabric you want to monitor. For end-to-end performance monitoring, an active Brocade Advanced Performance Monitoring license is required on switches that you want to monitor. Performance monitoring of port statistics does not require any special licenses on the switches that you want to monitor. Note The retrieval of port statistics and end-to-end monitoring of data can take longer than expected if you issue any CPU-intensive commands (such as the portTest diagnostic command) while performance monitoring is enabled. Fabric Manager Administrator's Guide 8-5 Publication Number: 53-1000196-01-HP
-
 1
1 -
2
-
3
-
4
-
5
-
6
-
7
-
8
-
9
-
10
-
11
-
12
-
13
-
14
-
15
-
16
-
17
-
18
-
19
-
20
-
21
-
22
-
23
-
24
-
25
-
26
-
27
-
28
-
29
-
30
-
31
-
32
-
33
-
34
-
35
-
36
-
37
-
38
-
39
-
40
-
41
-
42
-
43
-
44
-
45
-
46
-
47
-
48
-
49
-
50
-
51
-
52
-
53
-
54
-
55
-
56
-
57
-
58
-
59
-
60
-
61
-
62
-
63
-
64
-
65
-
66
-
67
-
68
-
69
-
70
-
71
-
72
-
73
-
74
-
75
-
76
-
77
-
78
-
79
-
80
-
81
-
82
-
83
-
84
-
85
-
86
-
87
-
88
-
89
-
90
-
91
-
92
-
93
-
94
-
95
-
96
-
97
-
98
-
99
-
100
-
101
-
102
-
103
-
104
-
105
-
106
-
107
-
108
-
109
-
110
-
111
-
112
-
113
-
114
-
115
-
116
-
117
-
118
-
119
-
120
-
121
-
122
-
123
-
124
-
125
-
126
-
127
-
 128
128 -
 129
129 -
 130
130 -
 131
131 -
 132
132 -
 133
133 -
 134
134 -
 135
135 -
 136
136 -
 137
137 -
 138
138 -
139
-
140
-
141
-
142
-
143
-
144
-
145
-
146
-
147
-
148
-
149
-
150
-
151
-
152
-
153
-
154
-
155
-
156
-
157
-
158
-
159
-
160
-
161
-
162
-
163
-
164
-
165
-
166
-
167
-
168
-
169
-
170
-
171
-
172
-
173
-
174
-
175
-
176
-
177
-
178
-
179
-
180
-
181
-
182
-
183
-
184
-
185
-
186
-
187
-
188
-
189
-
190
-
191
-
192
-
193
-
194
-
195
-
196
-
197
-
198
-
199
-
200
-
201
-
202
-
203
-
204
-
205
-
206
-
207
-
208
-
209
-
210
-
211
-
212
-
213
-
214
-
215
-
216
-
217
-
218
-
219
-
220
-
221
-
222
-
223
-
224
-
225
-
226
-
227
-
228
-
229
-
230
-
231
-
232
-
233
-
234
-
235
-
236
-
237
-
238
-
239
-
240
-
241
-
242
-
243
-
244
-
245
-
246
-
247
-
248
-
249
-
250
-
251
-
252
-
253
-
254
-
255
-
256
-
257
-
258
-
259
-
260
-
261
-
262
-
263
-
264
-
265
-
266
-
267
-
268
-
269
-
270
-
271
-
272
-
273
-
274
-
275
-
276
-
277
-
278
-
279
-
280
-
281
-
282
-
283
-
284
-
285
-
286
-
287
-
288
-
289
-
290
-
291
-
292
-
293
-
294
-
295
-
296
-
297
-
298
-
299
-
300
-
301
-
302
-
303
-
304
-
305
-
306
-
307
-
308
-
309
-
310
-
311
-
312
-
313
-
314
-
315
-
316
-
317
-
318
-
319
-
320
-
321
-
322
-
323
-
324
-
325
-
326
-
327
-
328
-
329
-
330
-
331
-
332
-
333
-
334
-
335
-
336
-
337
-
338
-
339
-
340
-
341
-
342
-
343
-
344
-
345
-
346
-
347
-
348
-
349
-
350
-
351
-
352
-
353
-
354
-
355
-
356
-
357
-
358
-
359
-
360
-
361
-
362
-
363
-
364
-
365
-
366
-
367
-
368
-
369
-
370
-
371
-
372
-
373
-
374
-
375
-
376
-
377
-
378
-
379
-
380
-
381
-
382
-
383
-
384
-
385
-
386
-
387
-
388
-
389
-
390
-
391
-
392
-
393
-
394
-
395
-
396
-
397
-
398
-
399
-
400
-
401
-
402
-
403
-
404
-
405
-
406
 |
 |