HP StorageWorks 2/16V Brocade Fabric Manager Administrator's Guide (53-1000019 - Page 129
Using Performance Monitoring
 |
View all HP StorageWorks 2/16V manuals
Add to My Manuals
Save this manual to your list of manuals |
Page 129 highlights
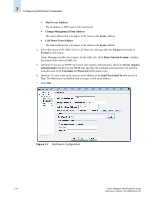
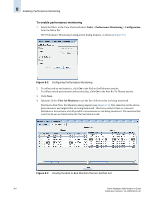
Using Performance Monitoring Chapter 8 The performance monitoring feature in Fabric Manager provides insight into how much traffic a particular port or device is generating on the fabric over a specific timeframe. It is also used to indicate the devices that are creating the most traffic and to identify the ports that are the most congested. Performance monitoring is enabled or disabled on an entire fabric, not on a switch or port basis. Before you can enable performance monitoring and create reports, graphs, or report templates, you must first log in to the seed switch of the fabric. The seed switch must have an activated Brocade Advanced Performance Monitoring license if you want the end-to-end feature (it is not required for port statistics monitoring). End-to-end monitors are not set on switches without the license. The benefit of using performance monitoring is diminished if it is enabled or disabled on an as-needed basis. Performance monitoring should be enabled constantly to receive the necessary historical data required for a meaningful report. You can use Fabric Manager or an external tool (such as Crystal Reports) to run reports and generate graphs based on the information captured in Fabric Manager. All the data collected in performance monitoring is stored in the database. If you are monitoring large fabrics, ensure that you have ample database space to store all of the information. If you delete a fabric, all performance monitoring data for that fabric is also deleted from the database. Note Fabric Manager does not support Advanced Performance Monitoring on iSCSI ports (GbE ports on the FC4-16IP port blade). See the following sections for information about working with performance monitoring: • "Performance Monitoring Components" on page 8-2 • "Enabling Performance Monitoring" on page 8-5 • "Disabling Performance Monitoring" on page 8-7 • "Generating Custom Reports and Graphs" on page 8-7 • "Creating and Using Report Templates" on page 8-13 • "Saving Performance Monitor Reports or Graphs" on page 8-17 • "Printing Performance Monitor Reports" on page 8-17 • "Exporting Reports" on page 8-18 • "Displaying Saved Reports and Graphs" on page 8-18 • "Deleting Reports and Graphs" on page 8-19 • "Editing Performance Monitor Graphs" on page 8-19 • "Displaying Performance Monitor Reports in External Applications" on page 8-20 Fabric Manager Administrator's Guide 8-1 Publication Number: 53-1000196-01-HP
-
 1
1 -
2
-
3
-
4
-
5
-
6
-
7
-
8
-
9
-
10
-
11
-
12
-
13
-
14
-
15
-
16
-
17
-
18
-
19
-
20
-
21
-
22
-
23
-
24
-
25
-
26
-
27
-
28
-
29
-
30
-
31
-
32
-
33
-
34
-
35
-
36
-
37
-
38
-
39
-
40
-
41
-
42
-
43
-
44
-
45
-
46
-
47
-
48
-
49
-
50
-
51
-
52
-
53
-
54
-
55
-
56
-
57
-
58
-
59
-
60
-
61
-
62
-
63
-
64
-
65
-
66
-
67
-
68
-
69
-
70
-
71
-
72
-
73
-
74
-
75
-
76
-
77
-
78
-
79
-
80
-
81
-
82
-
83
-
84
-
85
-
86
-
87
-
88
-
89
-
90
-
91
-
92
-
93
-
94
-
95
-
96
-
97
-
98
-
99
-
100
-
101
-
102
-
103
-
104
-
105
-
106
-
107
-
108
-
109
-
110
-
111
-
112
-
113
-
114
-
115
-
116
-
117
-
118
-
119
-
120
-
121
-
122
-
123
-
 124
124 -
 125
125 -
 126
126 -
 127
127 -
 128
128 -
 129
129 -
 130
130 -
 131
131 -
 132
132 -
 133
133 -
 134
134 -
135
-
136
-
137
-
138
-
139
-
140
-
141
-
142
-
143
-
144
-
145
-
146
-
147
-
148
-
149
-
150
-
151
-
152
-
153
-
154
-
155
-
156
-
157
-
158
-
159
-
160
-
161
-
162
-
163
-
164
-
165
-
166
-
167
-
168
-
169
-
170
-
171
-
172
-
173
-
174
-
175
-
176
-
177
-
178
-
179
-
180
-
181
-
182
-
183
-
184
-
185
-
186
-
187
-
188
-
189
-
190
-
191
-
192
-
193
-
194
-
195
-
196
-
197
-
198
-
199
-
200
-
201
-
202
-
203
-
204
-
205
-
206
-
207
-
208
-
209
-
210
-
211
-
212
-
213
-
214
-
215
-
216
-
217
-
218
-
219
-
220
-
221
-
222
-
223
-
224
-
225
-
226
-
227
-
228
-
229
-
230
-
231
-
232
-
233
-
234
-
235
-
236
-
237
-
238
-
239
-
240
-
241
-
242
-
243
-
244
-
245
-
246
-
247
-
248
-
249
-
250
-
251
-
252
-
253
-
254
-
255
-
256
-
257
-
258
-
259
-
260
-
261
-
262
-
263
-
264
-
265
-
266
-
267
-
268
-
269
-
270
-
271
-
272
-
273
-
274
-
275
-
276
-
277
-
278
-
279
-
280
-
281
-
282
-
283
-
284
-
285
-
286
-
287
-
288
-
289
-
290
-
291
-
292
-
293
-
294
-
295
-
296
-
297
-
298
-
299
-
300
-
301
-
302
-
303
-
304
-
305
-
306
-
307
-
308
-
309
-
310
-
311
-
312
-
313
-
314
-
315
-
316
-
317
-
318
-
319
-
320
-
321
-
322
-
323
-
324
-
325
-
326
-
327
-
328
-
329
-
330
-
331
-
332
-
333
-
334
-
335
-
336
-
337
-
338
-
339
-
340
-
341
-
342
-
343
-
344
-
345
-
346
-
347
-
348
-
349
-
350
-
351
-
352
-
353
-
354
-
355
-
356
-
357
-
358
-
359
-
360
-
361
-
362
-
363
-
364
-
365
-
366
-
367
-
368
-
369
-
370
-
371
-
372
-
373
-
374
-
375
-
376
-
377
-
378
-
379
-
380
-
381
-
382
-
383
-
384
-
385
-
386
-
387
-
388
-
389
-
390
-
391
-
392
-
393
-
394
-
395
-
396
-
397
-
398
-
399
-
400
-
401
-
402
-
403
-
404
-
405
-
406
 |
 |